$SPONGE (SPONGE/USD) Faces Resistance at $0.00009; Bullish Momentum Consolidating Near $0.000053
Estimated Reading Time: 3 minutes
Don’t invest unless you’re prepared to lose all the money you invest. This is a high-risk investment and you are unlikely to be protected if something goes wrong. Take 2 minutes to learn more

In our recent analysis of SPONGE/USD, we observed a consistent and nuanced bullish market trend. However, upon reaching the $0.000077 price threshold, the market encountered significant bearish resistance, leading to a stagnation in price movement. This event coincided with a sharp decrease in market volatility, indicating the potential for a definitive directional shift.
During today’s trading session, there have been attempts by the market to break out in a bullish manner. Nevertheless, this breakout was impeded by another resistance level at $0.00009, triggering bearish activity that prompted bulls to regroup around the $0.00005 mark.
Key Market Dynamics:
- Resistance Levels: $0.0010, $0.0011, and $0.0012.
- Support Levels: $0.000035, $0.000030, and $0.000025.
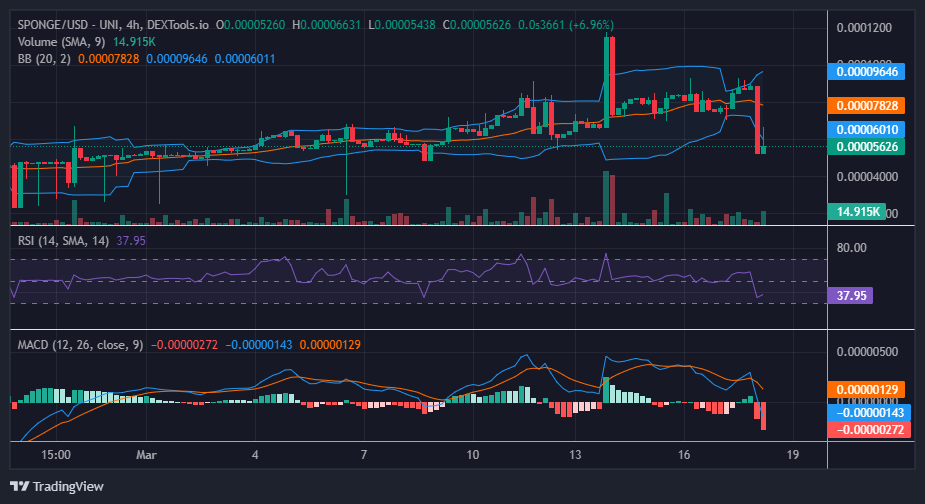
In-Depth Technical Analysis for $SPONGE (SPONGE/USD)
Based on the analysis of the 4-hour chart, a pronounced bearish trend is evident, indicating a heightened level of bearish sentiment in the market. This intensity of the SPONGE/USD bearish movement suggests the potential for its sustainability to be questioned.
In the current 4-hour trading session, a bullish inverted hammer candlestick pattern has formed. While traditionally interpreted as a signal of impending bearish activity, particularly at the peak of an uptrend, its occurrence at the trough of a downtrend indicates an emerging bullish presence in the market.
Furthermore, the Bollinger Bands suggest that due to the significant bearish momentum, volatility has increased. This heightened volatility presents an opportunity for bulls to capitalize and potentially drive the market back towards a bullish trajectory.

Insights from the 1-Hour Perspective
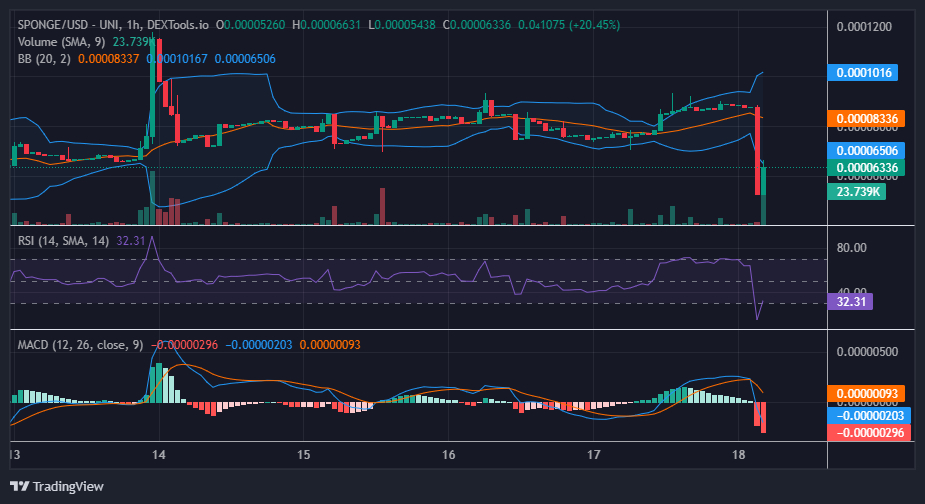
Based on the 1-hour chart analysis, it’s evident that the recent bearish movement during the last trading session swiftly pushed the market into oversold territory. The Relative Strength Index (RSI) indicates the initiation of a corrective phase. This crypto signal presents an opportune moment for new traders to consider entering the market.
Should the market successfully breach the $0.00009 level, it could potentially pave the way for a move towards $0.00012.
Buy SPONGE/USD!
Crypto #HODLERS after the bear market 🧽💦#MemeCoin #Crypto #Alts #100x pic.twitter.com/Oss2tjYRLo
— $SPONGE (@spongeoneth) March 16, 2024
Invest in the hottest and best meme coin. Buy Sponge ($SPONGE) today!