$SPONGE (SPONGE/USD) Gradual Climb Targets Resistance at $0.00006
Estimated Reading Time: 2 minutes
Don’t invest unless you’re prepared to lose all the money you invest. This is a high-risk investment and you are unlikely to be protected if something goes wrong. Take 2 minutes to learn more

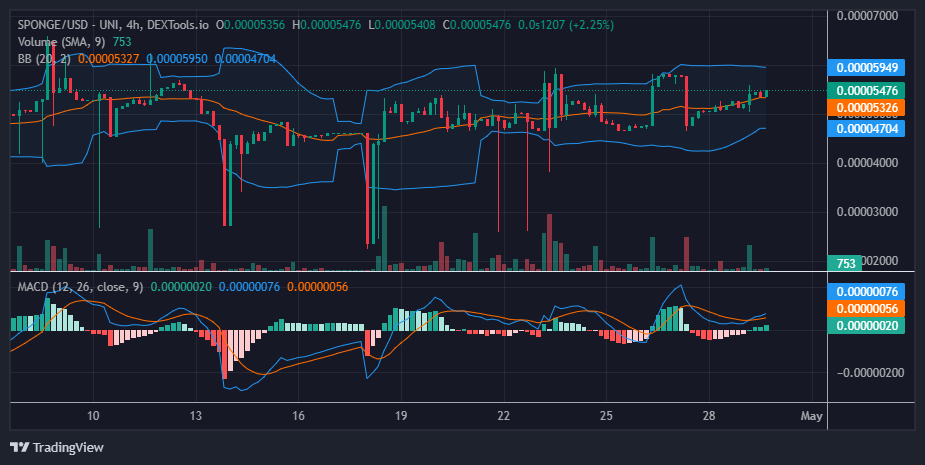
On April 26, the SPONGE/USD market exhibited a sudden bullish surge after a period of consolidation within a narrow price channel around $0.000045 (acting as support). The strength of the upward move appeared to culminate near $0.00006, potentially due to investor exhaustion. Consequently, a bearish correction on the following day brought the price back down towards the support level. However, the market has since begun a gradual upward trend, which could offer bulls another opportunity to breach the resistance at $0.00006.
Key Market Dynamics:
- Resistance Levels: $0.0010, $0.0011, and $0.0012.
- Support Levels: $0.000035, $0.000030, and $0.000025.
Delving into Technical Analysis for $SPONGE (SPONGE/USD)
Bollinger Band analysis suggests potential bullish activity, with the lower Bollinger Band trending upwards. This upward movement often indicates increasing price volatility and, potentially, upward momentum. However, the resistance level at $0.00006 has yet to be breached. A sustained uptrend impacting the resistance level and pushing it upward would solidify the bullish case. Such a development would increase the likelihood of the current bull run surpassing the current resistance. The recent rejection at this level may have temporarily strengthened the resistance. Nonetheless, consistent bullish pressure, even a gradual one, as seen currently from this crypto signal, could pave the way for a future breakout.
Insights from the 1-Hour Perspective:
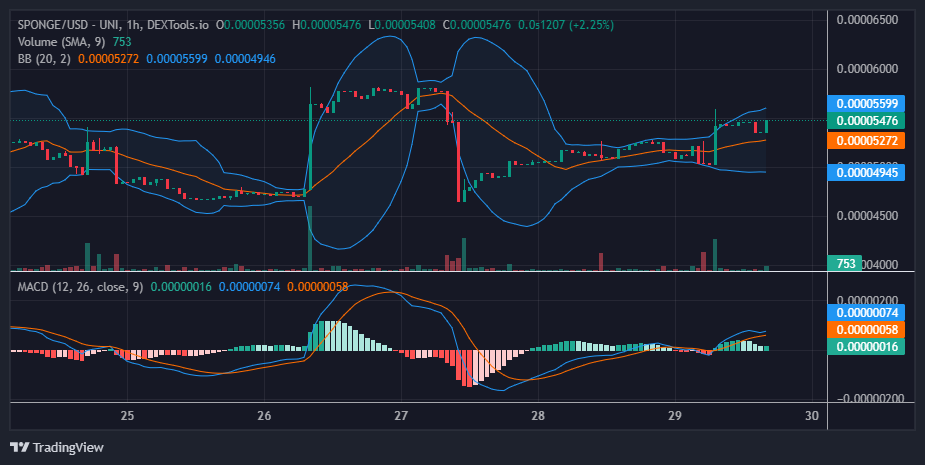
Based on the 1-hour chart, a clear bullish trend is evident. However, around the $0.000050 price level, market volatility increased, as confirmed by the widening of the Bollinger Bands. The market appears to have found support at around $0.000053. If SPONGE/USD bulls can hold this level against resistance, they may be able to maintain the upward trajectory towards $0.00006.
Buy SPONGE/USD!
Did someone say, damp…? 🧽 💦 $SPONGE #SpongeV2 #MemeCoin pic.twitter.com/seUpTv6bUF
— $SPONGE (@spongeoneth) April 26, 2024
Invest in the hottest and best meme coin. Buy Sponge ($SPONGE) today!