$SPONGE (SPONGE/USD) Initiates Rally from $0.00005 Support Level
Estimated Reading Time: 2 minutes
Don’t invest unless you’re prepared to lose all the money you invest. This is a high-risk investment and you are unlikely to be protected if something goes wrong. Take 2 minutes to learn more

SPONGE/USD shows promise for a resurgence as it steadies itself around the $0.00005 mark after facing a headwind at $0.000055. This retreat, however, doesn’t signal defeat; rather, it suggests a potential springboard for bullish momentum to gather pace, with signs of waning bearish sentiment. The price of the market has already begun to rally, even though the volume of trade seems low.
Key Market Dynamics:
- Resistance Levels: $0.0010, $0.0011, and $0.0012.
- Support Levels: $0.000035, $0.000030, and $0.000025.
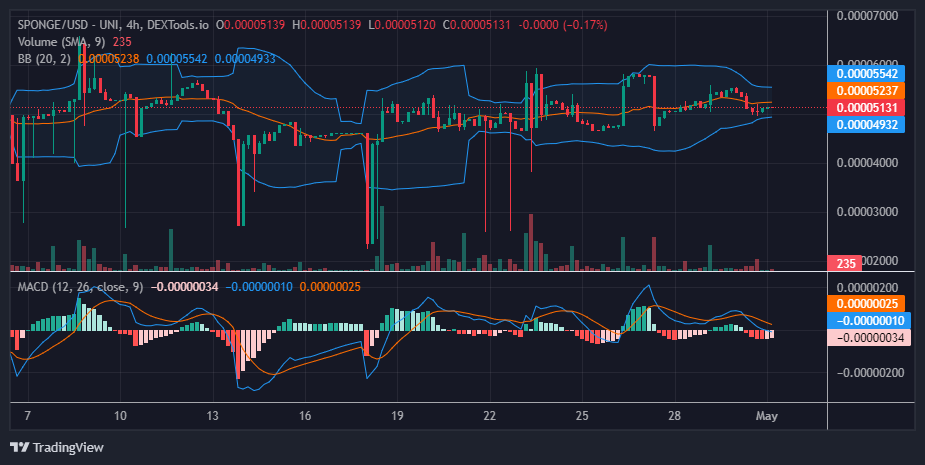
Delving into Technical Analysis for $SPONGE (SPONGE/USD)
In our last analysis of the SPONGE/USD market, we observed a clear downward trend in recent trends. In response to this, the Bollinger Bands converged, indicating a decline in market volatility. Interestingly, despite the bearish price movement, the lower bands were not significantly impacted. However, since the accompanying trade volume histograms remain low, this trend was deemed unsustainable, suggesting the potential for a rebound from this level. The market did indeed rebound, but trade volume still appears low. However, the Moving Average Convergence and Divergence (MACD), with its fading red histogram, begins to point to bullish activity, indicating a buildup of bullish momentum is underway.
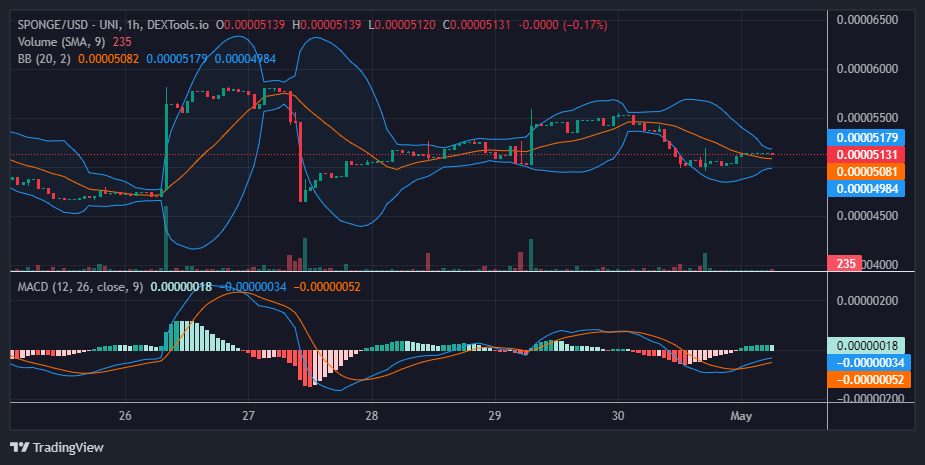
Insights from the 1-Hour Perspective:
As the market stabilized around $0.00005, signs of a bullish resurgence are emerging. Buyers initially began to balance demand and supply, but now we can already notice a slight shift, from around $0.00005 to approximately $0.000052. Just as bearish forces made their presence felt earlier in yesterday’s trading session, similarly, according to this crypto signal, a bullish breakout might be on the horizon from this juncture onwards.
Ride the wave with SPONGE/USD!
Someone say $SPONGE?! 🧽💦#MemeCoin #Crypto #Staking #BTC pic.twitter.com/0f4qU07L7q
— $SPONGE (@spongeoneth) April 30, 2024
Invest in the hottest and best meme coin. Buy Sponge ($SPONGE) today!