$SPONGE (SPONGE/USD) Navigates Choppy Waters Around $0.000038
Estimated Reading Time: 3 minutes
Don’t invest unless you’re prepared to lose all the money you invest. This is a high-risk investment and you are unlikely to be protected if something goes wrong. Take 2 minutes to learn more

The SPONGE/USD market is currently hovering around the $0.000039 level, a price it has been testing for some time. Bearish pressure persists near the $0.00004 resistance, creating a tug-of-war between buyers and sellers, yet bulls remain resilient.
A look at the 4-hour chart shows a recent dip toward the $0.0000006 support level, which was quickly met with a surge in buying activity. This suggests that some traders are eager to capitalize on price declines. However, despite the rebound, the $0.00004 resistance remains a key barrier to further upward movement.
Key Price Levels:
- Resistance: $0.000040, $0.000045, $0.000050
- Support: $0.000019, $0.000018, $0.000017
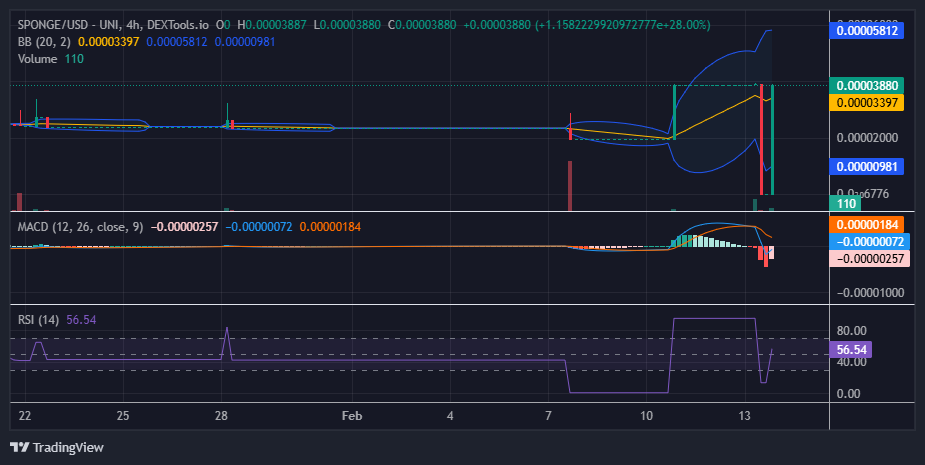
$SPONGE Technical Analysis
The $0.000039 price level has proven to be a critical resistance zone, as repeated bullish breakout attempts have been met with strong rejection near the $0.00004 mark. The recent sharp rejection at this level is evident in the MACD indicator, which displays strong negative histograms and a steep drop as the faster MACD line crossed below the zero level.
However, the bearish momentum was short-lived, as the faster MACD line quickly rebounded, retracing toward the slower line. This shift is reflected in a significantly smaller histogram compared to the previous one. SPONGE/USD traders seized the opportunity to “buy the dip,” triggering a swift recovery that mirrored the preceding decline.
This rapid turnaround in the crypto signal suggests the potential for a breakout above $0.00004, provided the bulls can sustain their momentum. If buying pressure continues to build, this breakout could occur in the next trading session.
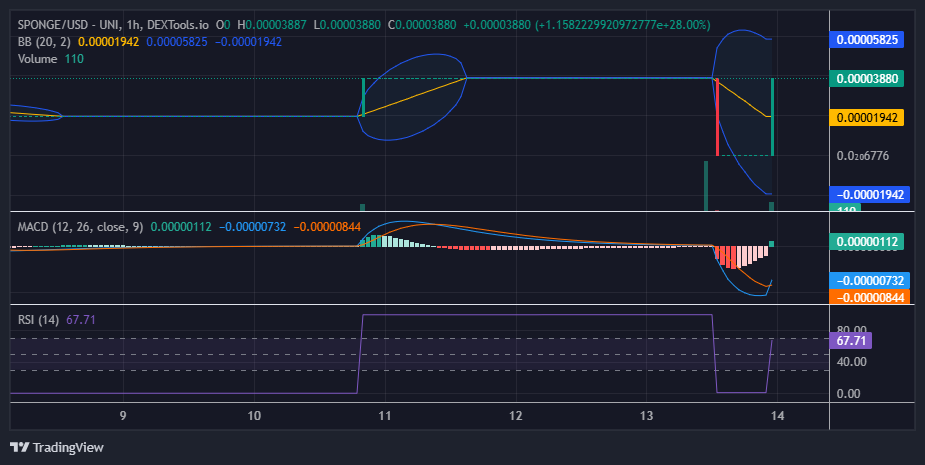
$SPONGE (SPONGE/USD) 1-Hour Chart Observations
The 1-hour chart’s MACD indicator paints a picture of a market in flux. The diminishing red histograms suggest a weakening bearish sentiment. Nevertheless, caution prevails as the price approaches the $0.000039 resistance, a level that has previously rejected upward movement. This hesitancy is visible in the smaller volume histograms accompanying the current bullish candlesticks. A successful breach of the $0.000039 resistance, coupled with sustained buying volume, could pave the way for a more sustained bullish trend. However, failure to overcome this resistance could lead to further consolidation or a renewed push by the bears.
Buy $SPONGE!
First bull cycle, anon? pic.twitter.com/eToKZaMQdI
— $SPONGE (@spongeoneth) February 14, 2025
Join the SPONGE community and be part of the next big crypto sensation! Buy Sponge ($SPONGE) today!