$SPONGE (SPONGE/USD) Price Swings: Bulls Battle to Hold $0.000055 Frontier
Estimated Reading Time: 3 minutes
Don’t invest unless you’re prepared to lose all the money you invest. This is a high-risk investment and you are unlikely to be protected if something goes wrong. Take 2 minutes to learn more

After the SPONGE/USD bulls achieved a decisive victory by overcoming resistance at the $0.000055 price level, they must maintain their grip as bearish influence is approaching again. Consequently, bullish support has shifted slightly lower to the $0.00005 level and then back to $0.000055. Given the resilience of this resistance level, a key question arises: Is this price surge sustainable? The chart indicates that the market is maintaining a marginal difference from the $0.000055 level. Bulls will need to withstand some bearish pressure, but if they can hold their position, bears may be forced to retreat to the $0.00006 level.
Key Market Dynamics:
- Resistance Levels: $0.0010, $0.0011, and $0.0012.
- Support Levels: $0.000035, $0.000030, and $0.000025.
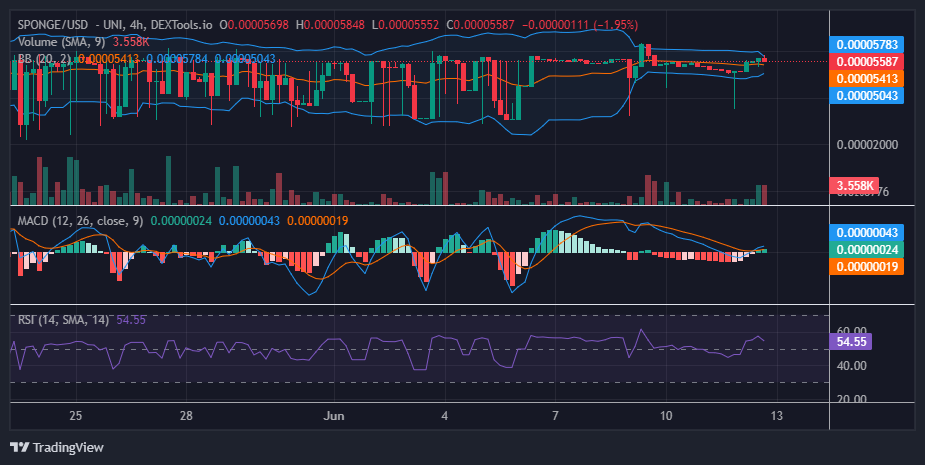
Delving into Technical Analysis for $SPONGE (SPONGE/USD)
The recent significant push above the $0.00006 price level signals increasing strength for the bulls and a potential weakening of bearish influence in this zone. However, bears have mounted a counterattack, forcing bullish activity to retreat to the $0.00005 level. Currently, price action has returned to $0.000055, with bulls maintaining their position. With sustained movement above $0.000055, bulls are gaining momentum to break the bears’ hold, potentially leading to an upward price movement.
Indicators suggest strong indecision in the market. The current SPONGE/USD price stands at $0.000055, accompanied by substantial volume shown in the trade indicator’s histograms. The Moving Average Convergence and Divergence (MACD) indicator shows convergence at zero, indicating heightened investor interest. However, the balance between supply and demand is keeping the price constrained. With Bollinger bands converging around the price action, a clear direction for the market is imminent, ideally favoring an upward movement.
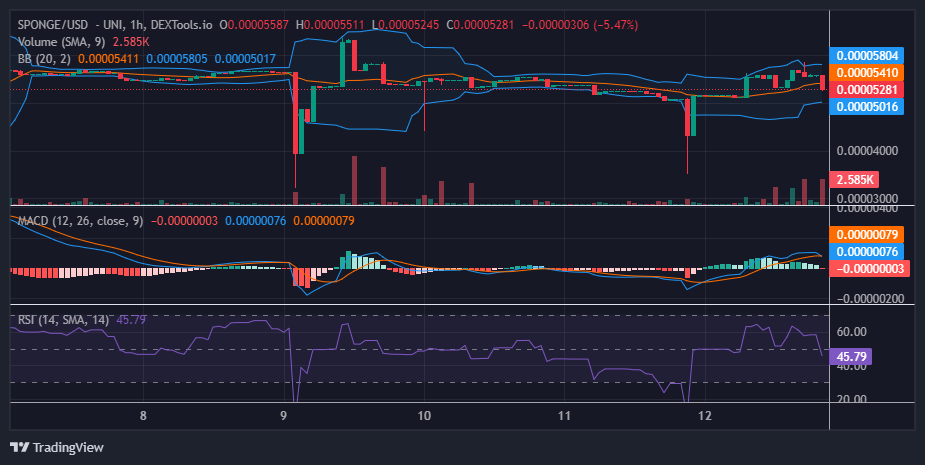
Insights from the 1-Hour Perspective
The 1-hour chart perspective of the market continues to indicate high volatility. While we observed the convergence of Bollinger bands on the 4-hour chart, they remain wide here. This suggests that the outcome of the ongoing market developments remains uncertain, with the price holding steady at $0.000055. However, bulls may potentially leverage the significant momentum indicated by the RSI crypto signal at level 58 to establish dominance at the current price level.
Buy $SPONGE!
We’ve got some updates to share with you soon! 🔥
Nobody can stop $SPONGE. 🧽💦 pic.twitter.com/Ha25IpwHvy
— $SPONGE (@spongeoneth) June 11, 2024
Invest in the hottest and best meme coin. Buy Sponge ($SPONGE) today!