$SPONGE (SPONGE/USD) Surges Towards Key Resistance at $0.000058
Estimated Reading Time: 3 minutes
Don’t invest unless you’re prepared to lose all the money you invest. This is a high-risk investment and you are unlikely to be protected if something goes wrong. Take 2 minutes to learn more

In the last analysis of SPONGE/USD, the crypto signal shows that the market was poised to persist within a narrow range, oscillating between support and resistance levels as volatility levels declined. However, an unexpected breakout has initiated a bullish trend, exerting pressure on the pivotal resistance level at $0.000058. To establish an upward trajectory for the market, it is imperative for the price to surpass both the $0.000058 and $0.00006 thresholds. Presently, the price hovers in proximity to these critical levels.
Key Market Dynamics:
- Resistance Levels: $0.0010, $0.0011, and $0.0012.
- Support Levels: $0.000035, $0.000030, and $0.000025.
Delving into Technical Analysis for $SPONGE (SPONGE/USD):
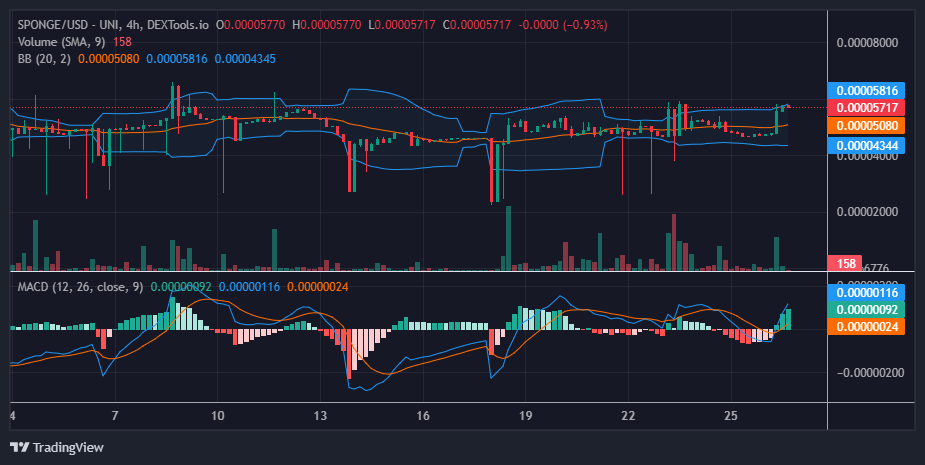
The significant surge in bullish activity observed during today’s trading session has reintroduced volatility into the market. However, despite this resurgence, bearish sentiment persists at the $0.000058 level. Consequently, the market continues to trade laterally, albeit within a broad range, as indicated by the Bollinger Bands indicator.
For the SPONGE/USD bulls to gain further traction, they must sustain upward pressure to breach the resistance levels at $0.000058 and $0.00006. Alternatively, should bullish momentum hold around the $0.00006 price level, allowing for a period of sideways movement, it could facilitate the establishment of a support level. This, in turn, might compel bearish positions to adjust to higher price levels.
Insights from the 1-Hour Perspective:
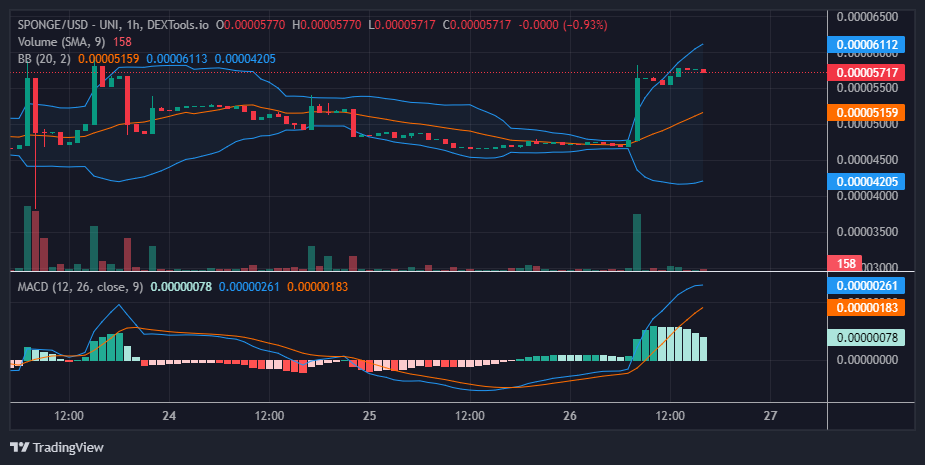
The current market scenario shows sideways movement near the $0.000058 mark, as observed on the 1-hour chart. Should additional bullish pressure be applied, there’s potential for an upward breakout. However, analysis of indicators, particularly the Moving Average Convergence and Divergence (MACD), reveals a diminishing green histogram, indicating waning bullish momentum. Consequently, the present conditions may not favor an immediate breakthrough in resistance levels.
Nevertheless, if bulls intervene at a significantly higher support level, such as $0.000055, it could enhance the likelihood of a successful outcome.
Absorb the Damp!
Once you start there’s no going back.$SPONGE #MemeCoin #Crypto pic.twitter.com/Nx93DJGIXD
— $SPONGE (@spongeoneth) April 26, 2024
Invest in the hottest and best meme coin. Buy Sponge ($SPONGE) today!