SPONGE/USD ($SPONGE) Breaks Out Above Critical $0.0001 Support, Surges Higher
Estimated Reading Time: 3 minutes
Don’t invest unless you’re prepared to lose all the money you invest. This is a high-risk investment and you are unlikely to be protected if something goes wrong. Take 2 minutes to learn more

In previous analyses, we highlighted clear signals pointing to an impending bullish breakout in the SPONGE/USD market. One notable indication was the convergence of the 20-day moving average with a horizontally consolidating price action—a classic precursor to a major market shift.
Our earlier commentary suggested that investors could remain confident in a potential rebound, given the historical behavior of the market around the $0.0001 support level. This key threshold has consistently acted as a strong foundation, with minimal risk of a sustained drop below it.
As anticipated, the market has respected this level, and those who maintained a bullish position are now seeing gains. At the time of writing, SPONGE/USD has climbed to approximately $0.000105, confirming the breakout and validating the bullish outlook.
Key Levels to Watch
- Resistance: $0.000110, $0.000120, $0.000130
- Support: $0.000090, $0.000085, $0.000080
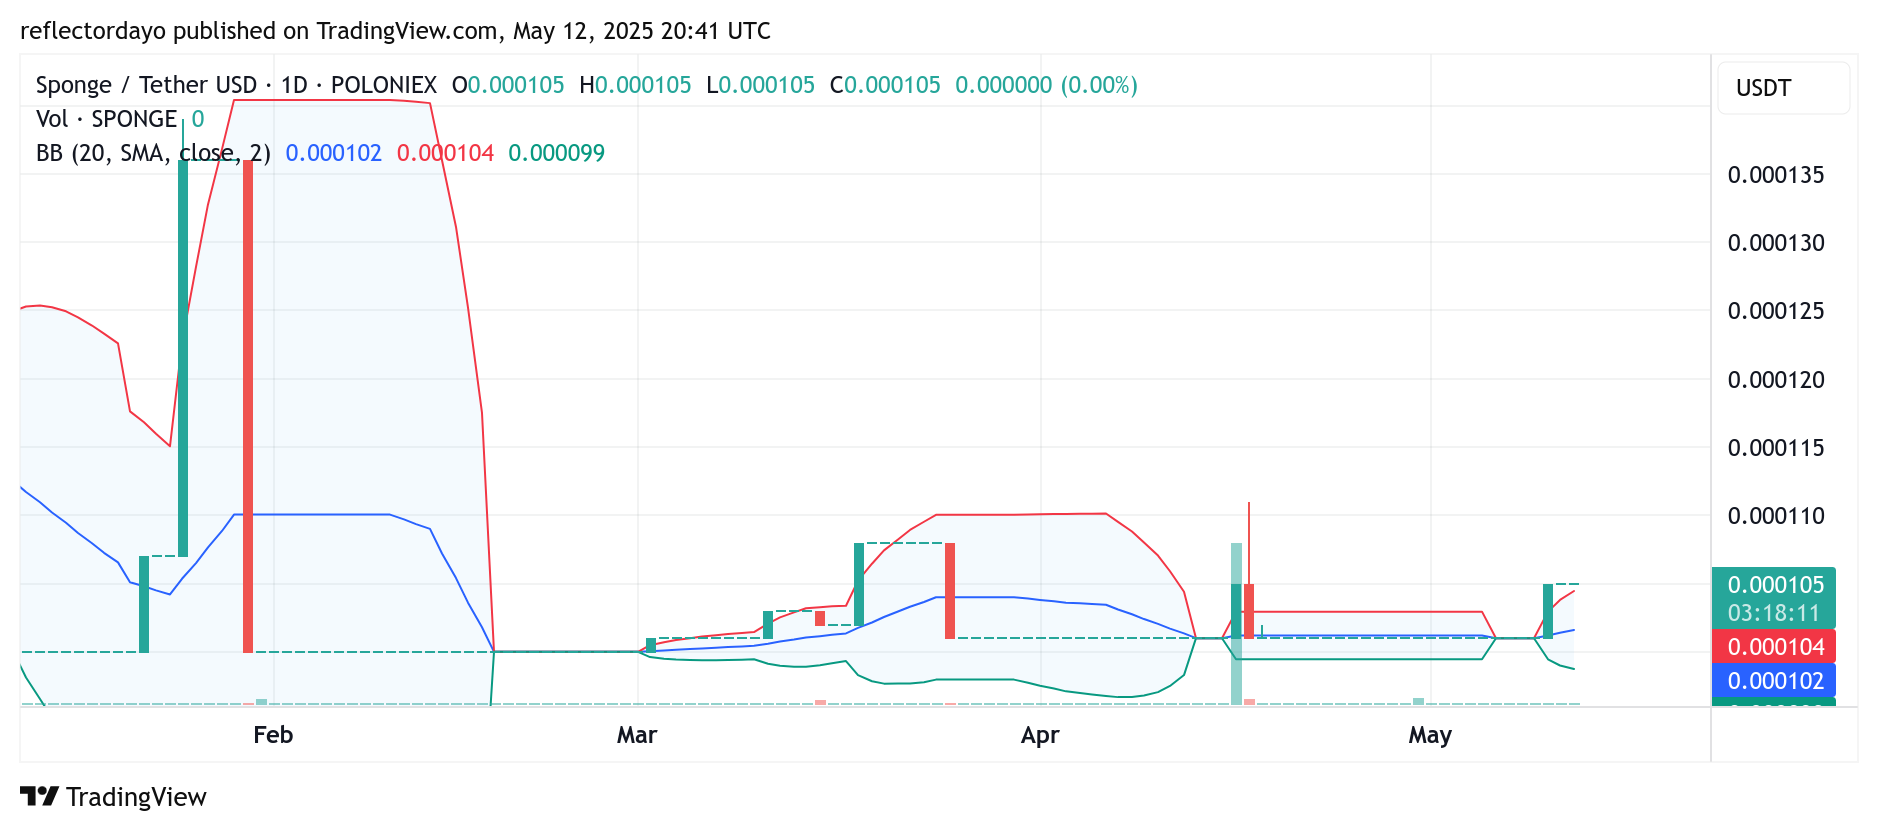
SPONGE/USD Daily Chart: Bulls Challenge Bearish Hold at $0.000105 Amid Rising Volatility
The SPONGE/USD daily chart is signaling heightened market activity, with indicators—particularly the Bollinger Bands—suggesting a potential for explosive movement. The recent price surge to the $0.000105 level has significantly increased volatility, pushing the market toward a critical threshold.
For some time, bears have held their ground at this resistance level. However, the emergence of two consecutive four-price Doji candlesticks—representing yesterday and today—indicates a strong price standoff between bulls and bears. This candlestick formation reflects indecision in the market, as bulls show resilience in what has traditionally been bearish territory.
If price consolidation persists around the $0.000105 level, it could set the stage for a bullish continuation, especially if buyers gain momentum and break through this resistance.
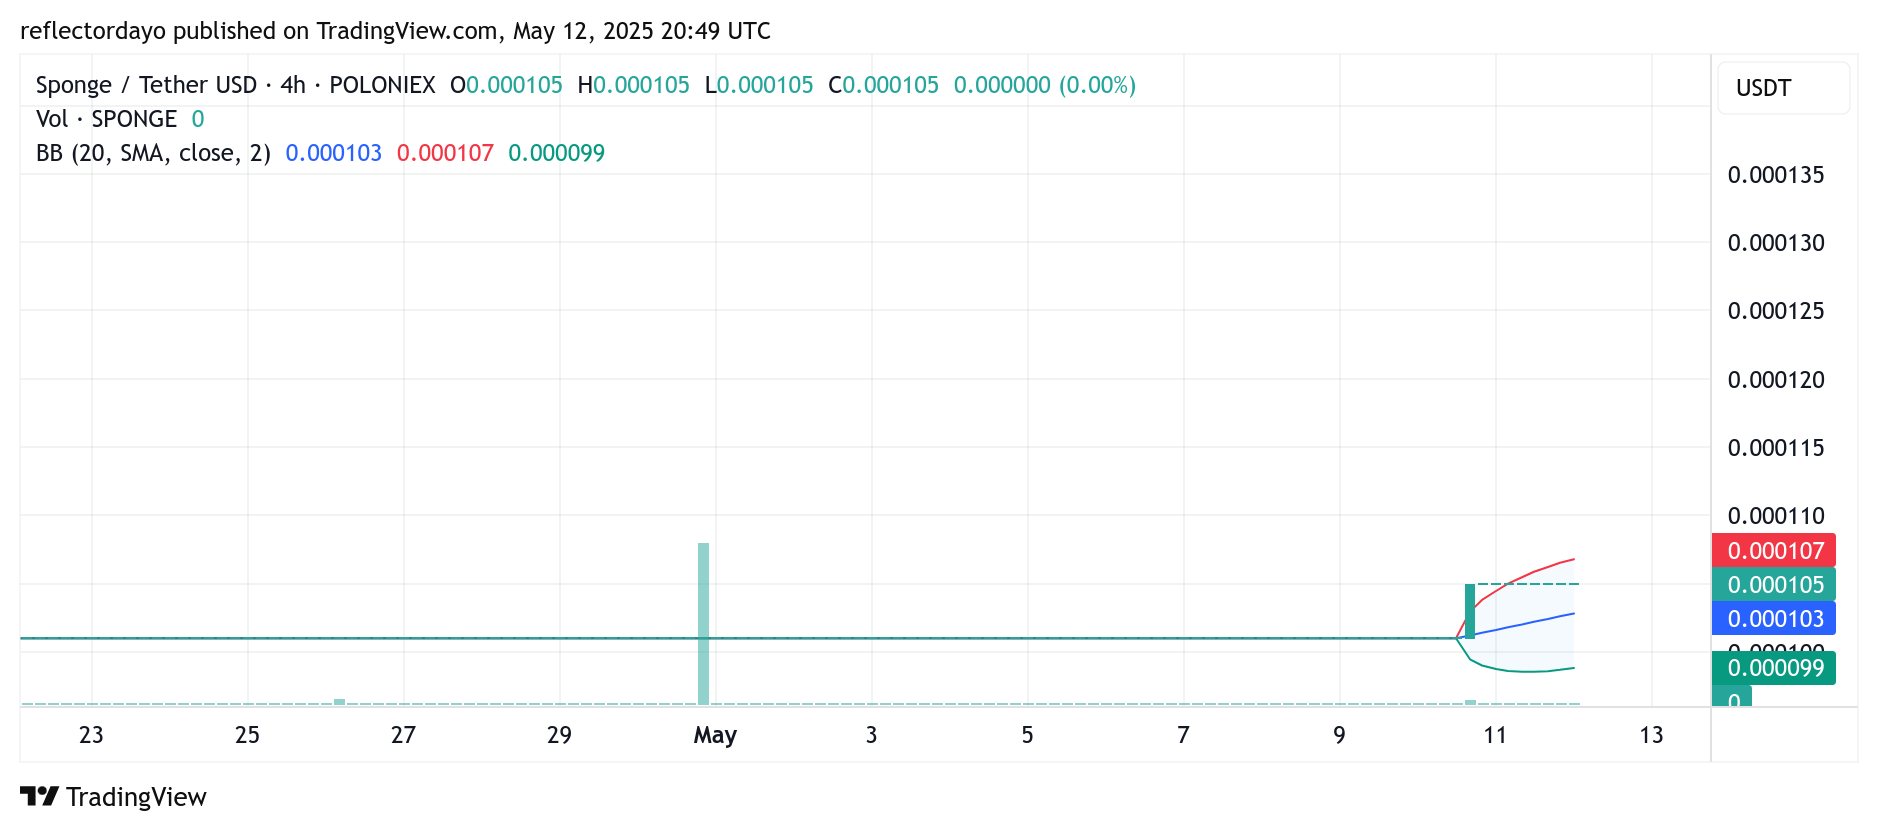
SPONGE/USD 4-Hour Chart: Bulls Show Strength as Price Action Consolidates Near $0.000105
On the 4-hour chart, the battle for control around the $0.000105 level has persisted across several sessions, signaling strong market resilience and the potential for continued upward momentum.
Despite heightened volatility, as reflected by the widening Bollinger Bands, the bands are now trending upward—an indication of bullish pressure gaining traction. If the Bollinger Bands begin to stabilize around the horizontal price action at $0.000105, it could create a favorable setup for buyers.
Given the impressive performance of bulls in recent sessions, a sustained consolidation at this level may pave the way for a breakout toward the next key resistance near $0.00011.
Buy SPONGE/USD!
Don’t be the guy who faded pic.twitter.com/tC1QJmLOkj
— $SPONGE (@spongeoneth) May 2, 2025
Join the SPONGE community and get in on the next big crypto opportunity! Buy Sponge ($SPONGE) today