SPONGE/USD ($SPONGE) Breaks Out, Eyeing a Move Toward $0.00011
Estimated Reading Time: 2 minutes
Don’t invest unless you’re prepared to lose all the money you invest. This is a high-risk investment and you are unlikely to be protected if something goes wrong. Take 2 minutes to learn more

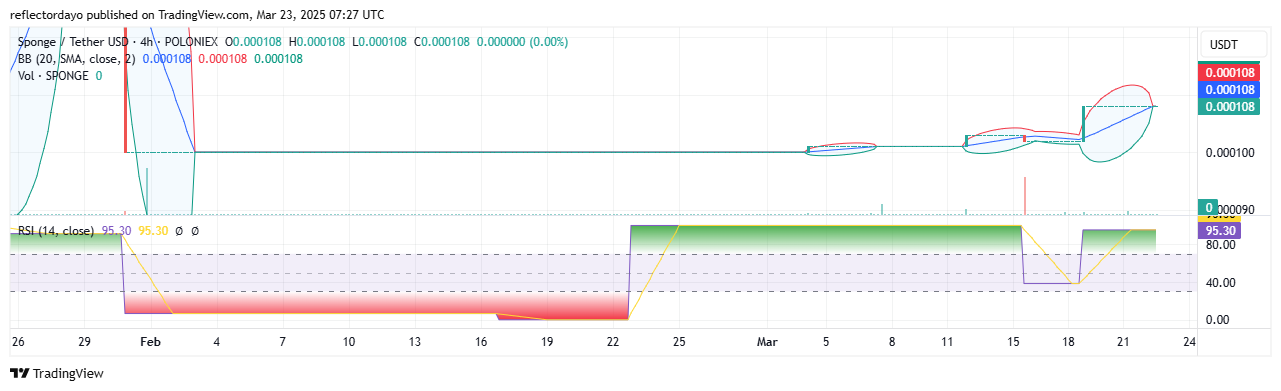
The price of the $SPONGE market has remained stable at the $0.0001 level for some time. Persistent bearish pressure has attempted to push the market to new lows, but the bulls have remained resilient, firmly defending this support. In March, the market began to gain upward momentum, driven by occasional surges in trading volume, indicating increased buying pressure. As a result, the price has started moving toward the $0.00011 level.
Key Levels to Watch
- Resistance: $0.000110, $0.00012, $0.00013
- Support: $0.000090, $0.0000850, $0.00008
SPONGE/USD ($SPONGE) Market Outlook: Technical Indicators Point of View
The trade volume indicator has shown a prolonged period of stability. However, occasional surges in trading volume have been observed, signaling increased $SPONGE market activity. This suggests that the bulls are gaining the upper hand, driving the price upward with a potential target of $0.00011.
Currently, the Relative Strength Index (RSI) is at 95, indicating that the market is in an overbought condition. Based on historical price patterns, a slight correction may occur, causing the price to pull back before rebounding toward the $0.00011 level. Additionally, the sharp convergence of the Bollinger Bands suggests that the market is preparing for a strong directional move. In this case, a minor retracement could precede a continuation of the bullish trend, with the price potentially solidifying above $0.00010.
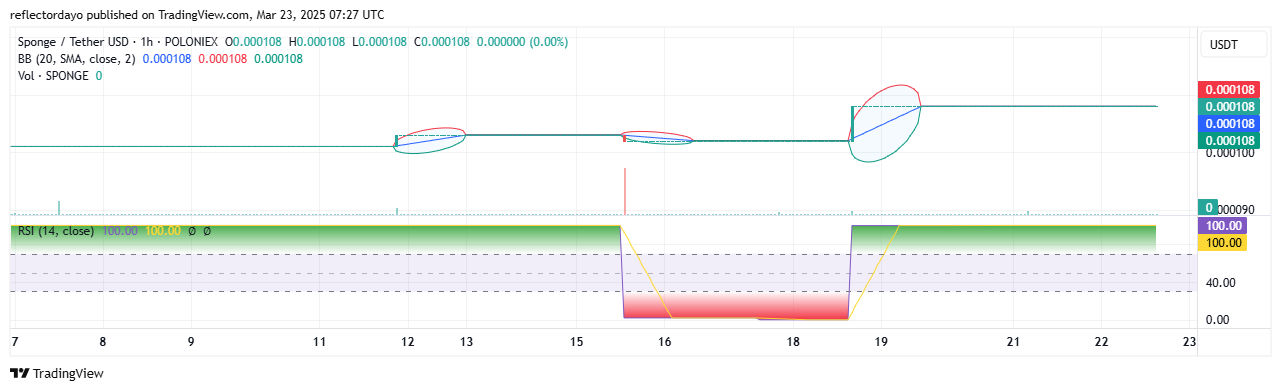
SPONGE/USD 1-Hour Chart Insights
A smaller timeframe analysis reinforces the same outlook. With the RSI line strongly positioned in the overbought region, a minor price correction is likely. However, this correction may not extend down to the key support at $0.0001 before the market rebounds toward the $0.00011 target. Traders should closely monitor market developments to capitalize on potential price movements.
Buy SPONGE/USD!
Survived another week in crypto pic.twitter.com/LmKJtM5eVb
— $SPONGE (@spongeoneth) March 21, 2025
Join the SPONGE community and be part of the next big crypto sensation! Buy Sponge ($SPONGE) today!