SPONGE/USD ($SPONGE) Builds Momentum for a Potential Bullish Breakout
Estimated Reading Time: 3 minutes
Don’t invest unless you’re prepared to lose all the money you invest. This is a high-risk investment and you are unlikely to be protected if something goes wrong. Take 2 minutes to learn more

The $SPONGE market has maintained a prolonged period of equilibrium around the critical $0.0001 price level, which has consistently served as a strong base of support for bullish traders in recent sessions. This stability highlights the significance of the $0.0001 threshold, making a downside break increasingly unlikely while positioning the market for a potential upward move.
Current price behavior resembles a “compressed” spring—appearing calm on the surface yet hinting at an underlying buildup of energy. Notably, the Bollinger Bands remain relatively wide, suggesting that volatility from previous movements is still influencing market dynamics. As a result, when a breakout does occur, it is likely to be sharp and forceful, favoring bullish momentum.
Key Price Levels to Watch
- Resistance: $0.000110, $0.000120, $0.000130
- Support: $0.000090, $0.000085, $0.000080
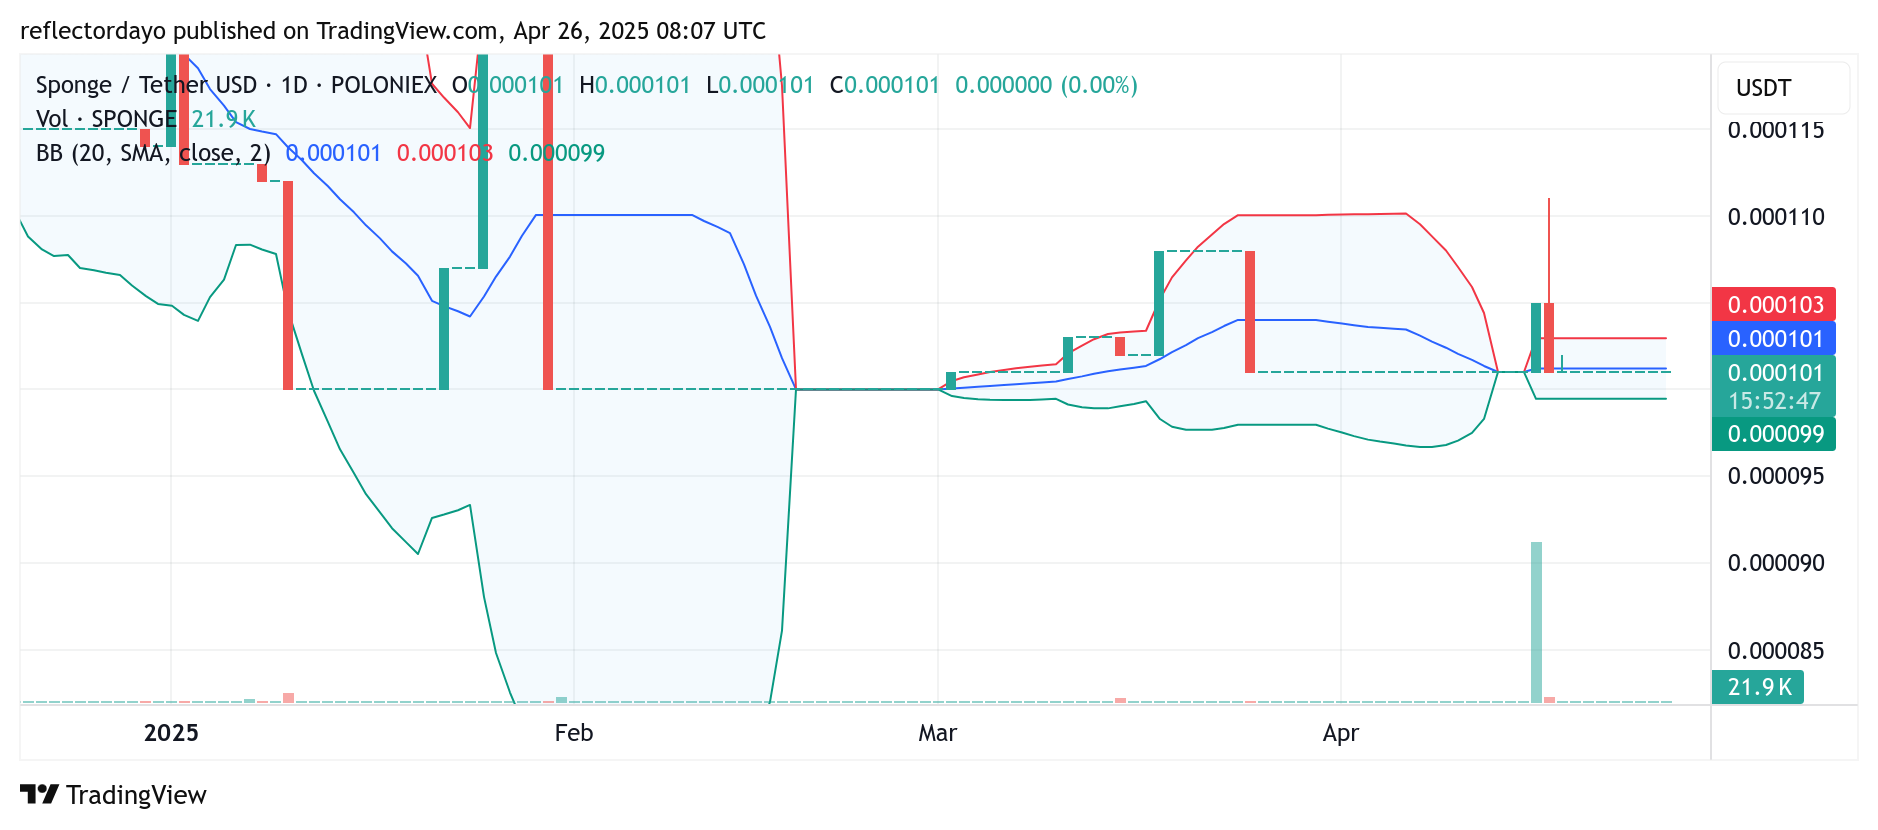
$SPONGE 24-Hour Technical Outlook: Market Stabilizes at $0.0001 as Bulls Hold Ground
Recent 24-hour trading sessions reveal a series of four-price doji candlesticks—small, no-bodied candles that reflect a highly stable and indecisive market environment. This repeated pattern reinforces the notion that the $0.0001 price level has become a strong anchor of support, with price action remaining flat for an extended period. As a result, the 20-day moving average has now converged with the horizontal price movement, confirming a state of prolonged market equilibrium.
Despite the sideways movement, historical price behavior suggests that a downward breakdown is unlikely. Instead, the market appears primed for a potential breakout. Interestingly, the Bollinger Bands remain relatively wide, suggesting that prior volatility still lingers in the market structure. This crypto signal could result in an abrupt price move once momentum returns. Traders should monitor for narrowing of the bands, which often signals the approach of a significant breakout or bounce.
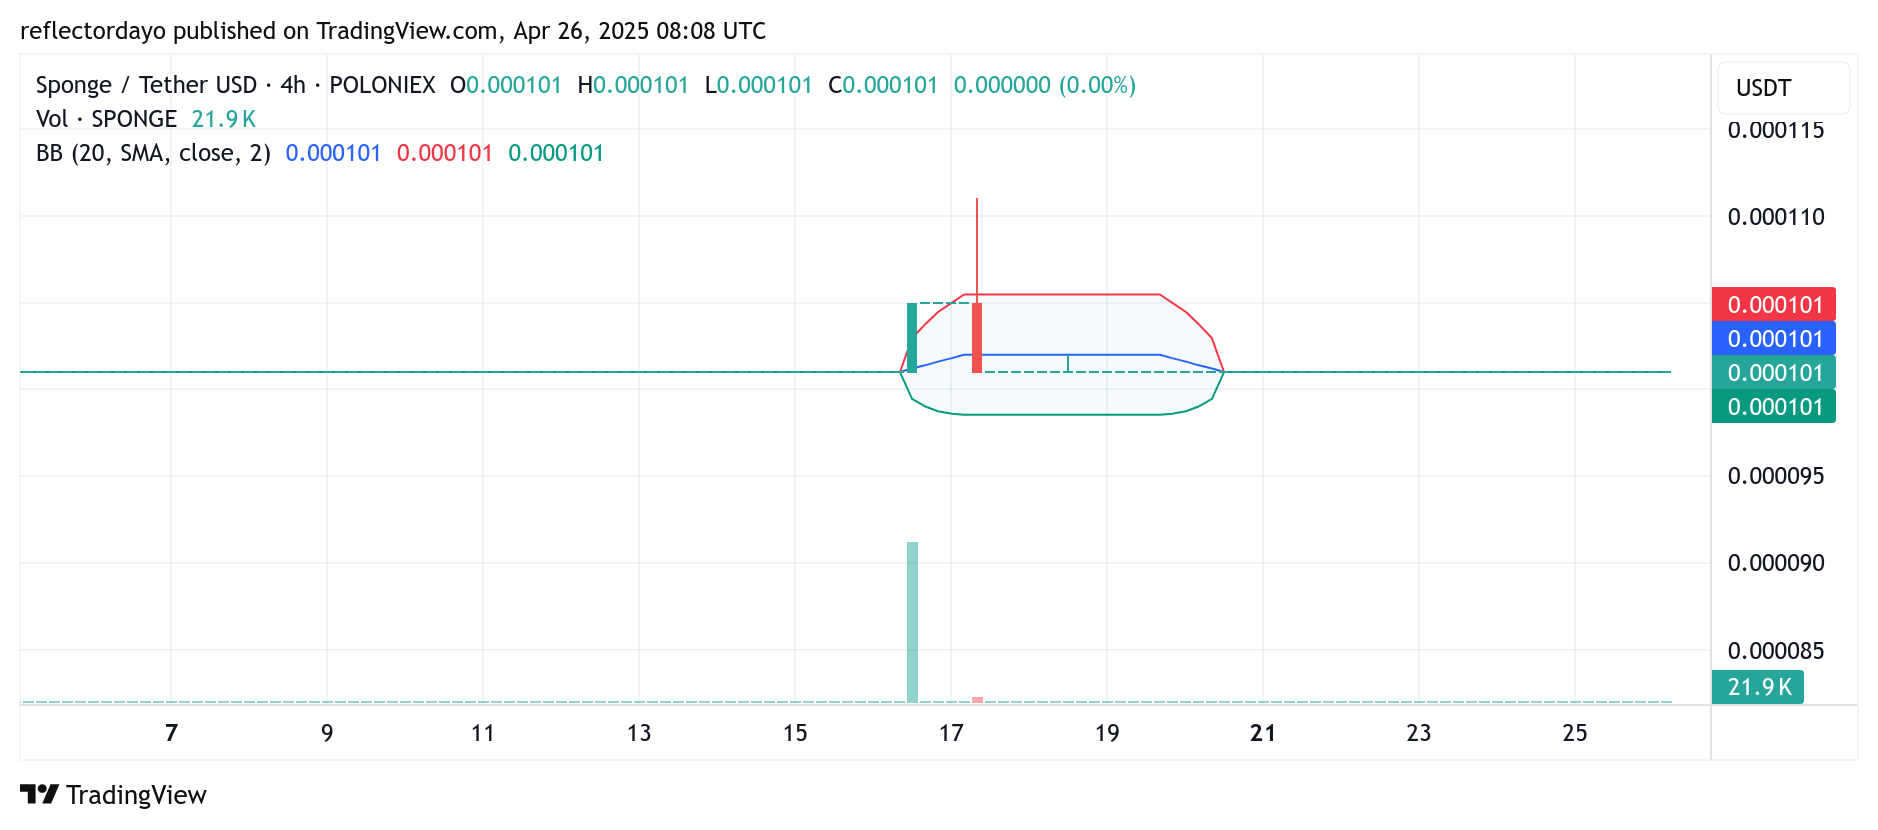
SPONGE/USD Short-Term Outlook: Tight Price Compression Signals Imminent Breakout on 4-Hour Chart
While the daily chart still reflects traces of past volatility through broader Bollinger Bands, the 4-hour chart tells a different story. Here, the Bollinger Bands have tightly contracted around the horizontally moving price action, signaling a period of low volatility and strong price compression.
This convergence often precedes a significant breakout. With the technical setup now favoring the potential for a bullish bounce, current market conditions suggest it could be an opportune time for traders to position for an upward move.
Buy SPONGE/USD!
Warren Buffet right now pic.twitter.com/e1sZShpaoG
— $SPONGE (@spongeoneth) April 25, 2025
Join the SPONGE community and get in on the next big crypto opportunity! Buy Sponge ($SPONGE) today