Sponge/USD ($Sponge) Bulls Build Momentum Towards a Significant Price Surge
Estimated Reading Time: 3 minutes
Don’t invest unless you’re prepared to lose all the money you invest. This is a high-risk investment and you are unlikely to be protected if something goes wrong. Take 2 minutes to learn more
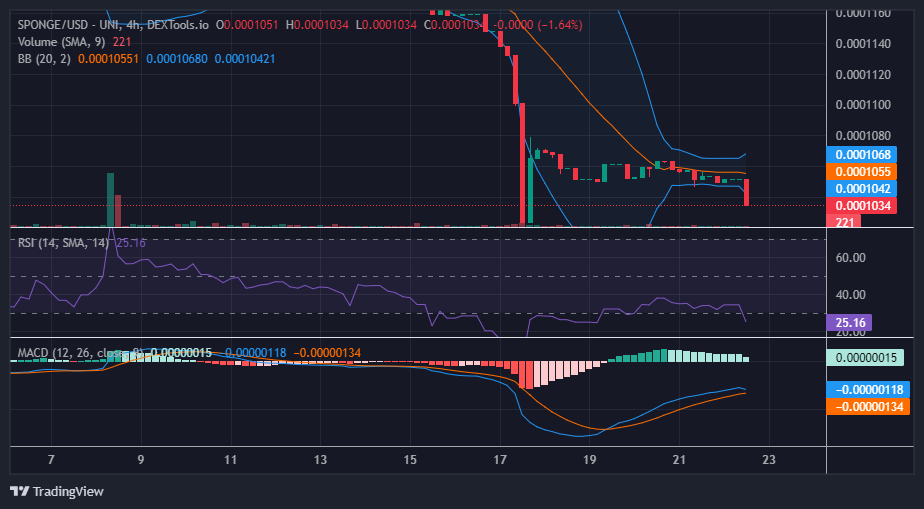
Over the past day, the SPONGE/USD market has exhibited little change, resulting in a continued state of stagnation. This has led to a narrow price range between $0.0001050 and $0.0001063, indicating a lack of decisive movement in either direction.
Since yesterday, the market has experienced a lack of significant price movements. The price has remained stagnant within a confined range of $0.0001050 and $0.0001063. This consolidation suggests a period of uncertainty and indecision among traders, as neither bears nor bulls have managed to gain a strong foothold.
Key Levels
- Resistance: $0.0004, $0.0045, and $0.0005.
- Support: $0.00011, $0.00010, and $0.00009.
Sponge (SPONGE/USD) Price Analysis: The Indicators’ Point of View
The Bollinger Bands, widely used for measuring price volatility, have exhibited a notable convergence. This convergence visually emphasizes the tight price range. As the bands tighten around the SPONGE/USD price action, it signifies a decreased level of market volatility. This reduction in volatility is often indicative of an impending breakout, as periods of low volatility are often followed by notable price movements.
The RSI is a key oscillator used to measure the strength of recent price changes. Currently, the RSI line is hovering sideways, slightly above the 30 level. This placement indicates that the market might have recently moved away from extreme oversold conditions. However, the RSI’s horizontal movement also suggests a degree of indecision and a lack of significant buying or selling pressure.
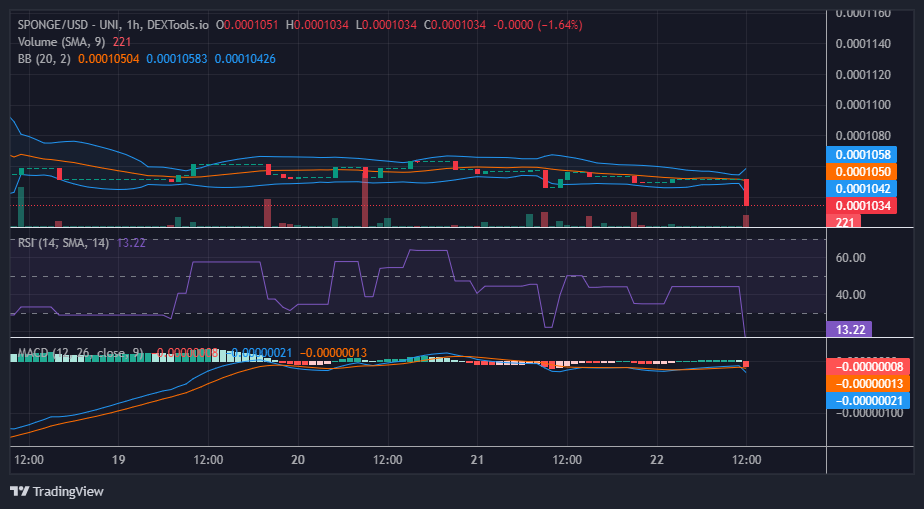
$SPONGE Short-Term Outlook: 1-Hour Chart
During market analysis, the SPONGE/USD experienced a sudden and significant bearish breakout characterized by a marubozu candlestick pattern, resulting in a price drop to $0.0001033. This type of movement has the potential to break the prevailing deadlock, presenting an opportunity for buyers to regain control of the market. Notably, the Bollinger Band is displaying signs of divergence, signaling the potential resolution of the deadlock.
Buy the dip!
#Bitcoin will always be king 👑🚀🤣 pic.twitter.com/rIWNYYBtJj
— $SPONGE (@spongeoneth) August 22, 2023
Invest in the hottest and best meme coin. Buy Sponge ($SPONGE) today!