Don’t invest unless you’re prepared to lose all the money you invest. This is a high-risk investment and you are unlikely to be protected if something goes wrong. Take 2 minutes to learn more
Amidst sustained bearish pressure, the bulls within the $SPONGE market have demonstrated commendable resilience, forging ahead in their pursuit of elevated price levels. The bullish market successfully traversed the bearish territory, situated between $0.0008036 and $0.00085. Despite facing selling pressure, the market is currently gaining upward momentum, with a focus on surpassing the $0.0009 threshold. However, it is noteworthy that, despite appearances, the price seems to have encountered a formidable resistance at $0.00085, leading to a notable struggle around this level. The ongoing standoff between demand and supply is reaching a critical juncture, potentially resulting in price consolidation around this level.
Key Market Dynamics:
Resistance Levels: $0.0010, $0.0011, and $0.0012.
Support Levels: $0.000450, $0.00040, and $0.00035.
Comprehensive Technical Analysis for $SPONGE (SPONGE/USD):
In the recent analysis, a series of inverted hammer candlesticks, traditionally indicative of an imminent bearish development, has paradoxically led to upward price movement, underscoring the resilience of $SPONGE bulls as they push through the bearish resistance zone. The positioning of the first inverted candlestick near the lowest point of the price retracement elucidates the ongoing upward trajectory, signifying the bulls’ increasing strength and determination in their pursuit of the $0.0009 target.
Current indicators signal a significant shift in the price indicator, transitioning from the bearish zone to the bullish zone. The Moving Average Convergence and Divergence (MACD) indicator displays a notable bullish histogram. Despite these positive signals, the journey towards the initial resistance level of $0.00085 is expected to encounter substantial headwinds, resulting in a battle between bullish and bearish sentiments around this level.
Insights from the 1-Hour Perspective:
Following the market’s successful overcoming of sell orders between $0.0008 and $0.00085, strong resistance has emerged at $0.00085, hindering further upward trajectory. Presently, the $SPONGE market is experiencing a notable retracement, with prices declining towards the $0.0008 level in the current trading session. It is plausible that this bearish movement within the 1-hour chart perspective may trigger a response from the bulls, leading to price consolidation around $0.00085 as prices oscillate within an increasingly narrow bandwidth. Observers are keenly monitoring for potential shifts in market dynamics.
Prepare to explore SpongeV2’s exclusive PlayToEarn game!
Arbitrum (ARB) Price Prediction: August 20 The ARB/USD trading pair has been in a prolonged downtrend since the second quarter of the year, with Arbitrum’s price consistently moving southwards. However, a closer look at the chart suggests a potential rebound might be near. Arbitrum will need more b...
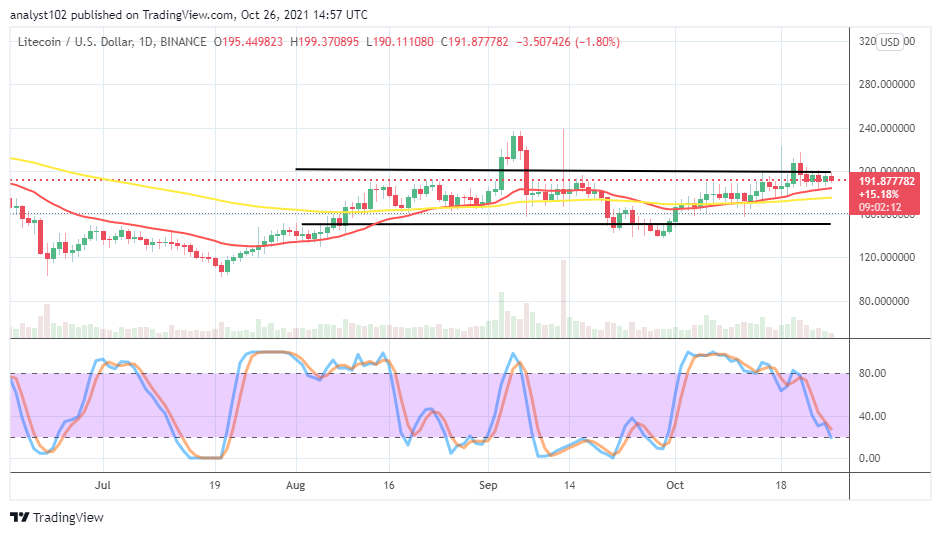
Litecoin Price Prediction – October 26It has been on a longer-term that the LTC/USD market volatility index relaxes around the level of $190 near the upper range line. The crypto economy trades around $191 as of writing, at a relative negative percentage rate of about 1.80. That indicates that a do...
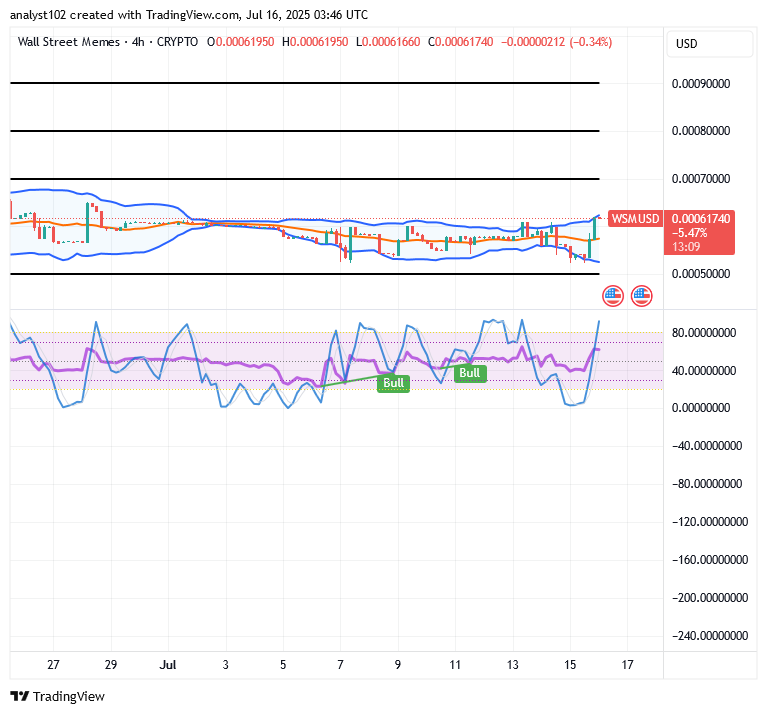
Wall Street Memes Price Prediction – July 16 Today’s business operations matching Wall Street Memes coin’s trade worth with the power of purchasing of the US currency have been visibly gaining momentum, given that the crypto-economic price shows up and keeps jerking around the trade line of $0.0006...
We send 3 VIP signals a week in our free Telegram group, each signal comes with a full technical analysis on why we are taking the trade and how to place it through your broker.
Get a taste of what the VIP group is like by joining now for FREE!