SPONGE/USD ($SPONGE) Bulls Still Have the $0.000118 Price Level Within Reach
Estimated Reading Time: 3 minutes
Don’t invest unless you’re prepared to lose all the money you invest. This is a high-risk investment and you are unlikely to be protected if something goes wrong. Take 2 minutes to learn more
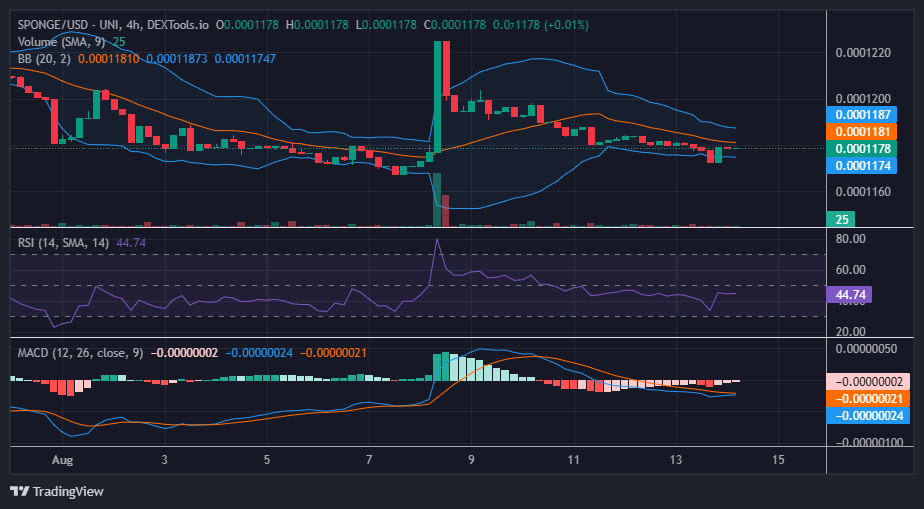
Following the breach of the $0.000118 demand level, the $SPONGE bear market gained momentum, pushing the price of the pair further downward. However, this bearish movement was relatively short-lived. During the concluding 4-hour session, the price experienced a drop but managed to find support around $0.0001172. This quick bounce back indicated a degree of resilience in the market.
It’s noteworthy that the $0.000118 price level, which previously acted as a strong support, has now transformed into a resistance level. The Bulls attempted to reclaim this level but were unsuccessful, leading to a reversal of roles. The resistance-turned-support scenario suggests that market sentiment has shifted and that previous support levels are now acting as barriers to upward movement.
Key Levels
- Resistance: $0.0004, $0.0045, and $0.0005.
- Support: $0.00011, $0.00010, and $0.00009.
SPONGE/USD ($SPONGE) Price Analysis: The Indicators’ Point of View
The Bollinger Bands indicator depicts a downtrending price channel characterized by relatively narrow bands. This indicates a period of reduced volatility and a relatively defined trading range. The recent $SPONGE market movement, particularly yesterday’s sharp movement and today’s strong bullish rebound, stands out against this backdrop.
The Moving Average Convergence and Divergence (MACD) indicator is providing valuable insights into the market’s momentum and potential trend reversal. The negative histograms, which represent the difference between the MACD line and the signal line, are diminishing in size and are fading in color. This reduction in negativity suggests waning bearish momentum. Additionally, the MACD lines are on the brink of a bullish crossover below the zero line. This crossover is a bullish signal that might indicate a shift towards positive price movement.
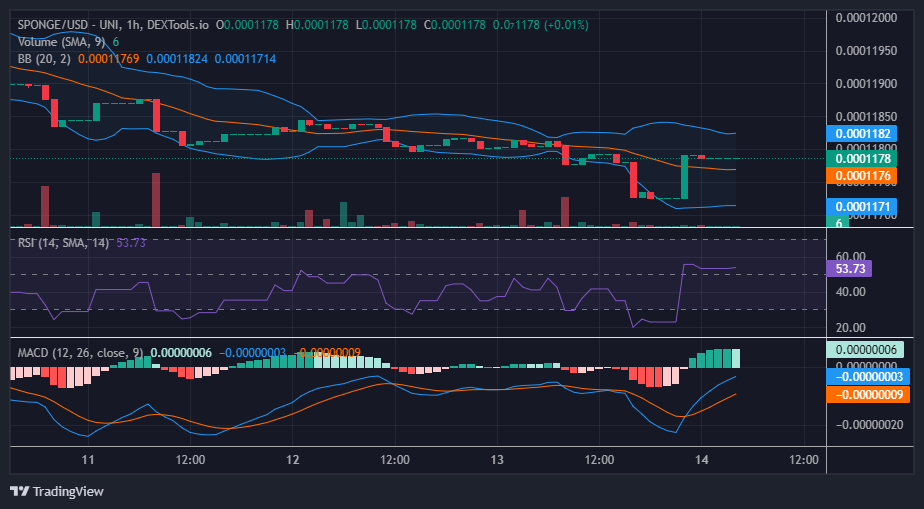
$SPONGE Short-Term Outlook: 1-Hour Chart
Looking at the 1-hour chart, it’s evident that the market became stagnant near the $0.0001178 price level, accompanied by the emergence of several doji candlestick patterns. The recently established supply level, that is, the $0.000118 price level, could potentially face pressure, and there’s a possibility that bulls might reclaim it to establish a support price zone. As positive sentiment strengthens around this level, there’s potential for the market to transition into a bullish cycle in the near future.
You can now start trading $SPONGE on Poloniex.
Attention all #SPONGERS! 🧽🌊
Commence trading $SPONGE on #Poloniex now! 💰🚀
Don’t wait, soak all the damp today! 🌊🌟
https://t.co/1Fq3Nsz7do pic.twitter.com/3jdtdiWyI2— $SPONGE (@spongeoneth) August 14, 2023
Invest in the hottest and best meme coin. Buy Sponge ($SPONGE) today!