SPONGE/USD ($SPONGE) Continues Sideways Movement at $0.0001 — Bullish Breakout in Sight?
Estimated Reading Time: 3 minutes
Don’t invest unless you’re prepared to lose all the money you invest. This is a high-risk investment and you are unlikely to be protected if something goes wrong. Take 2 minutes to learn more

The SPONGE/USD market remains in consolidation mode around the critical $0.0001 level, following a recent bullish rally that briefly lifted the price to the $0.000120 resistance area. Since then, the momentum has cooled, and price action has entered a narrow range, signaling a market in anticipation.
This extended period of sideways movement near a strong support zone often suggests that the asset is building a foundation for its next major move. If bullish momentum resurfaces, $SPONGE could break out of its current structure and target higher resistance levels. Traders are advised to watch this zone closely, as breakouts following prolonged consolidation tend to be significant.
Key Technical Levels
- Resistance: $0.000110, $0.000120, $0.000130
- Support: $0.000090, $0.000085, $0.000080
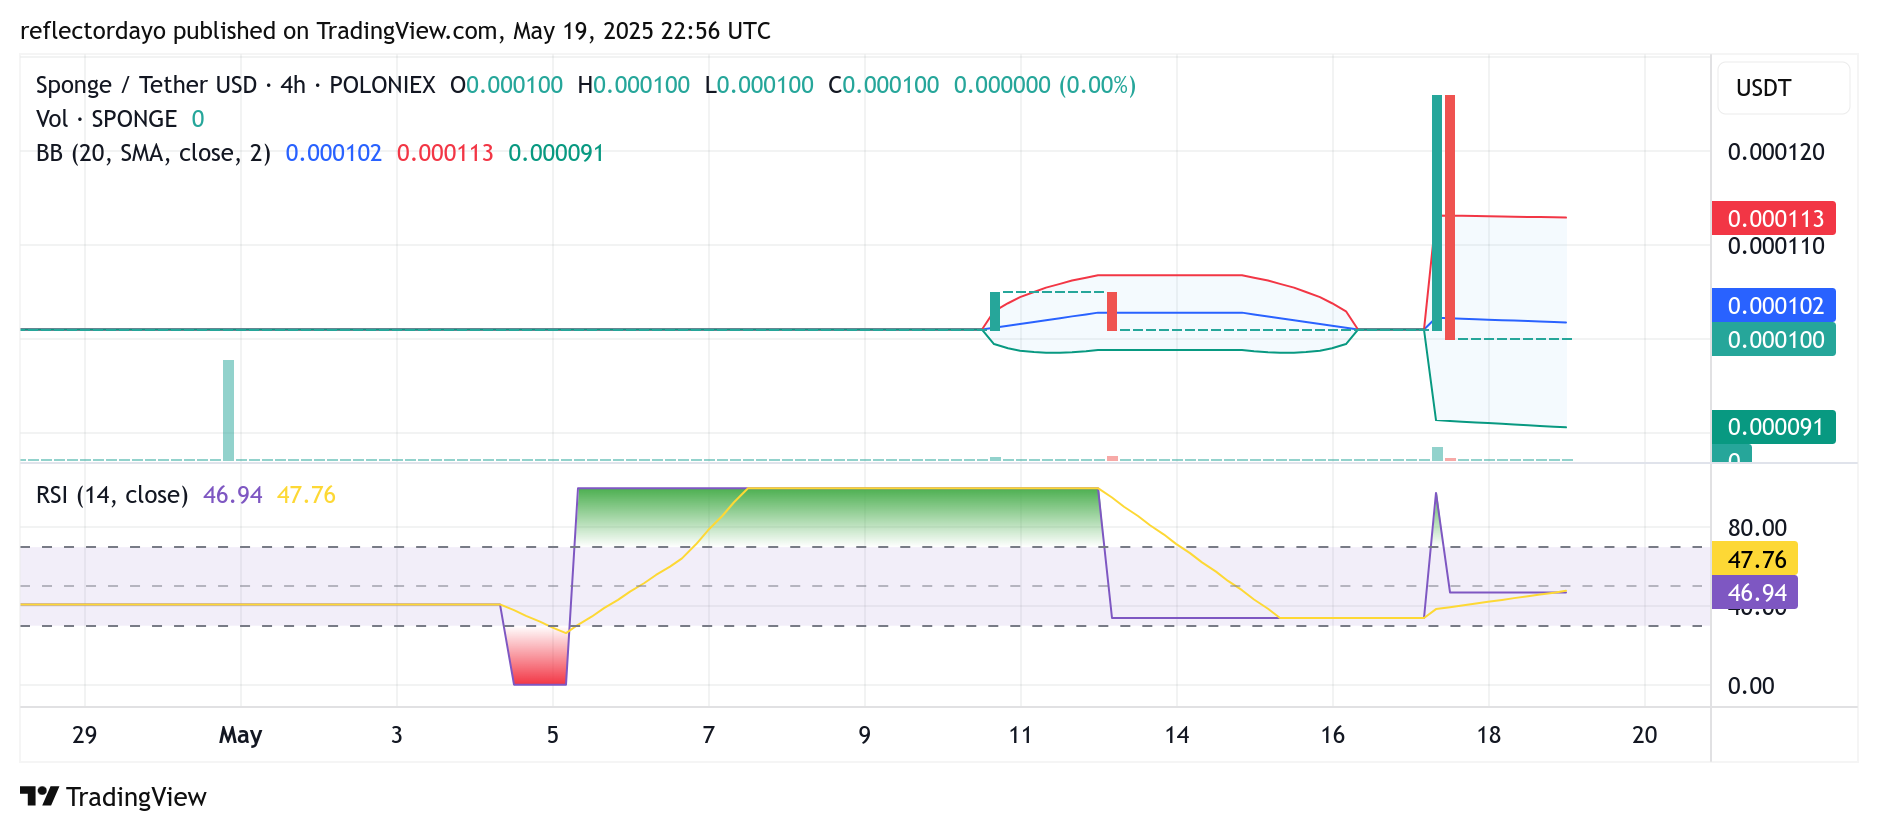
4-Hour Chart: Bulls Maintain Control as $SPONGE Stabilizes at Key Support
The recent bullish surge saw SPONGE/USD push toward a key resistance level, prompting profit-taking among early buyers. This led to a retracement, with the market pulling back to the $0.0001 mark. However, the decline was quickly arrested as bulls stepped in to defend this vital support level.
Price action has since stabilized, and bearish pressure appears to be losing steam. The continued defense of this support zone suggests growing accumulation, hinting at a possible resurgence in bullish sentiment. Should momentum return, a renewed move to the upside could soon follow.
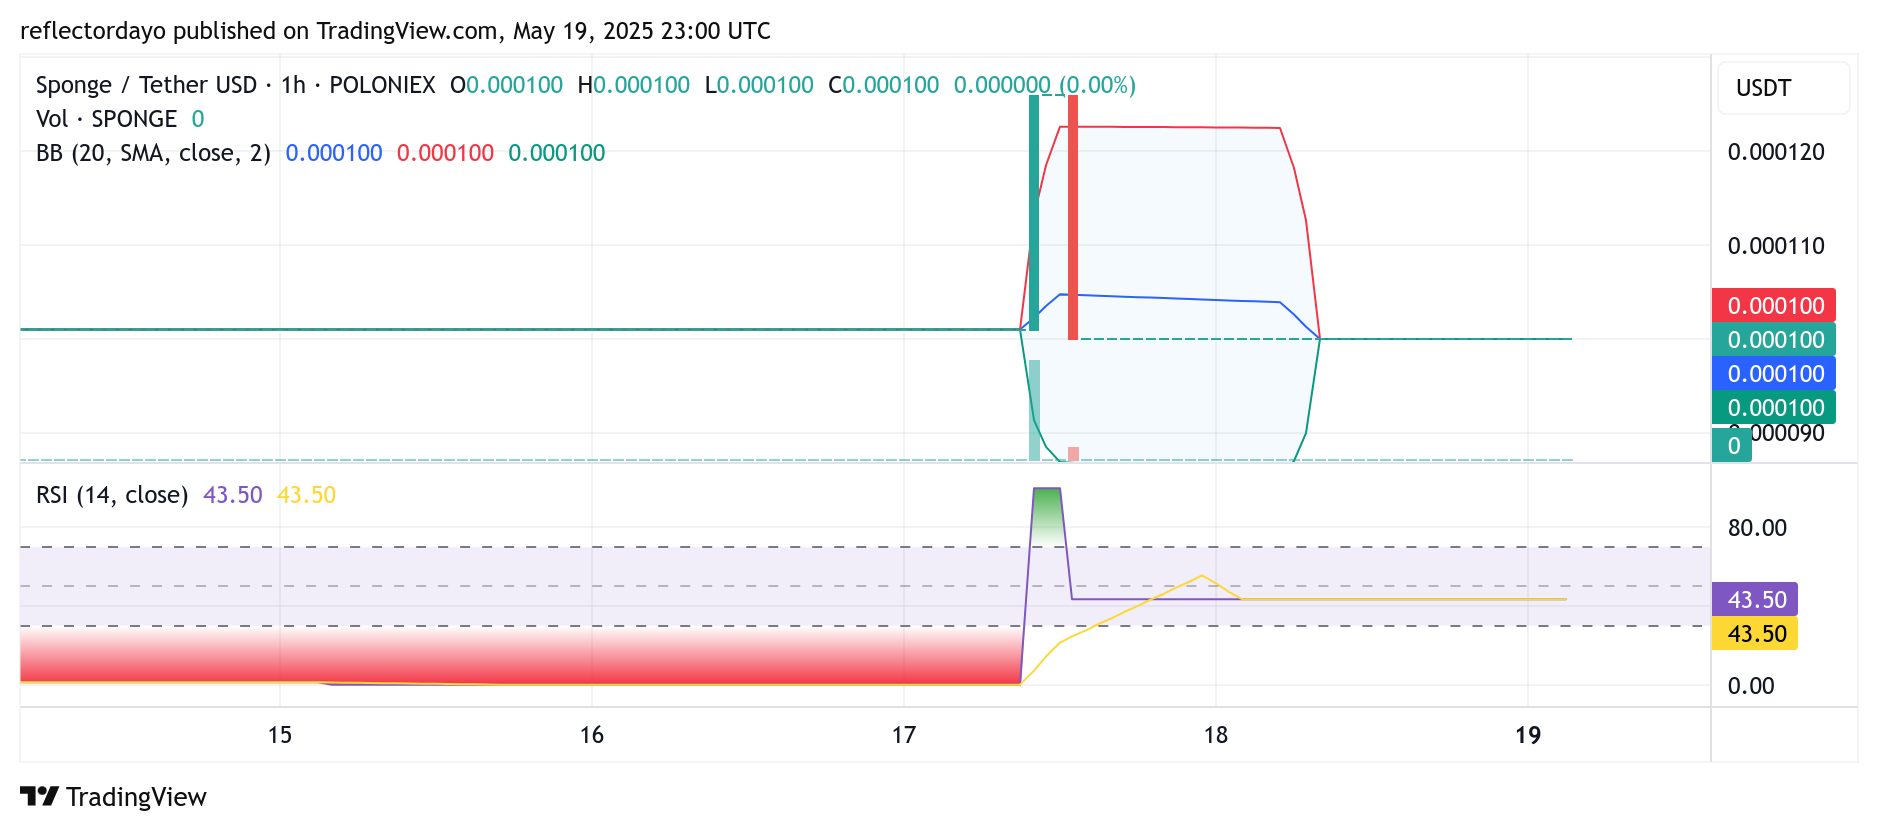
SPONGE/USD 1-Hour Chart: Tight Price Action Points to Impending Breakout
Short-term analysis on the 1-hour chart reinforces the outlook for a potential breakout. The Bollinger Bands have contracted tightly around the current price, reflecting declining volatility and signaling that a large move may be imminent.
The ongoing consolidation within a horizontal channel, coupled with signs of steady accumulation, indicates that bulls are quietly building strength. With market conditions aligning, a decisive upward breakout could occur soon, offering an attractive opportunity for traders positioned early.
Buy SPONGE/USD
Don’t be the guy who faded pic.twitter.com/tC1QJmLOkj
— $SPONGE (@spongeoneth) May 2, 2025
Join the SPONGE community and get in on the next big crypto opportunity! Buy Sponge ($SPONGE) today