SPONGE/USD ($SPONGE) Establishes Robust Support at the $0.00011 Price Level
Estimated Reading Time: 3 minutes
Don’t invest unless you’re prepared to lose all the money you invest. This is a high-risk investment and you are unlikely to be protected if something goes wrong. Take 2 minutes to learn more
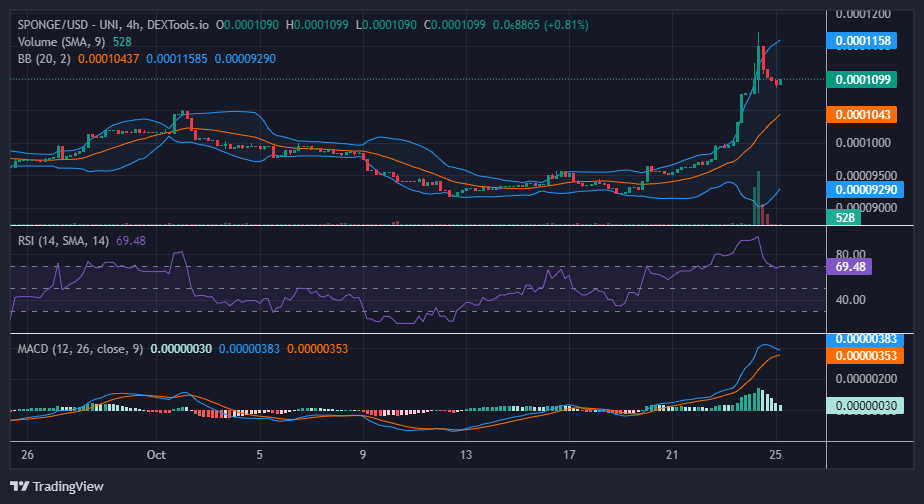
As previously noted in the analysis of SPONGE/USD, the remarkable strength of the recent bullish trend was anticipated to induce substantial profit-taking activities, and this prediction is currently unfolding in the market. The vigorous ascent during the preceding daily session propelled the price to approximately $0.000116, triggering the initiation of sell orders by traders. Subsequently, from the peak at the $0.000116 price level, the price has retraced to the $0.00011 price threshold. This retracement appears to have identified a level of support in the market, suggesting an effort to sustain the ongoing bullish sentiment.
Key Price Levels
- Resistance: $0.000115, $0.000120, and $0.000125.
- Support: $0.000090, $0.000080, and $0.000085.
Sponge (SPONGE/USD) Price Analysis: Technical Insights
As per the Bollinger Bands indicator, the ongoing retracement appears to be a corrective phase within the price range defined by the bands. This assessment is supported by the market finding support comfortably above the 20-day moving average. The Bollinger Bands indicator continues to outline an upward-trending price channel, reaffirming a robust bullish sentiment for the SPONGE/USD market. In parallel, the trade volume indicator indicates a decline in the volume of SPONGE being traded, suggesting the increasing plausibility of a price consolidation phase around the $0.00011 price level.
On the other hand, the Relative Strength Index (RSI) indicates that, despite the recent retracement, the market still resides in overbought territory. This raises the potential for a slight dip, as some traders might interpret the RSI level of 69 as a sign that the correction could persist. However, if bullish investors can maintain their position at the current support level, it could pave the way for the continuation of the bullish trend.
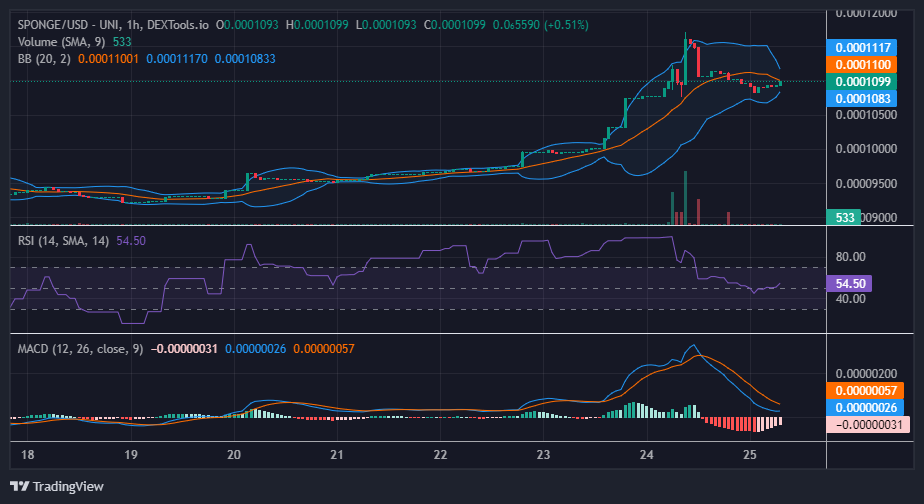
Short-Term Outlook: 1-Hour Chart
On a shorter time frame analysis, it becomes apparent that the market has reached a temporary equilibrium in the vicinity of the $0.00011 price range, with both bullish and bearish forces engaged in a balanced struggle for control. The stabilization of the market around this price level is evident in the converging Bollinger Bands, while the Relative Strength Index (RSI) now indicates a state of equilibrium, hovering around the 50 level.
This period of consolidation appears to be reinforcing the current support level, setting the stage for a potential resumption of the bullish price movement. It will be essential to monitor this developing scenario for potential shifts in market dynamics and trading sentiment.
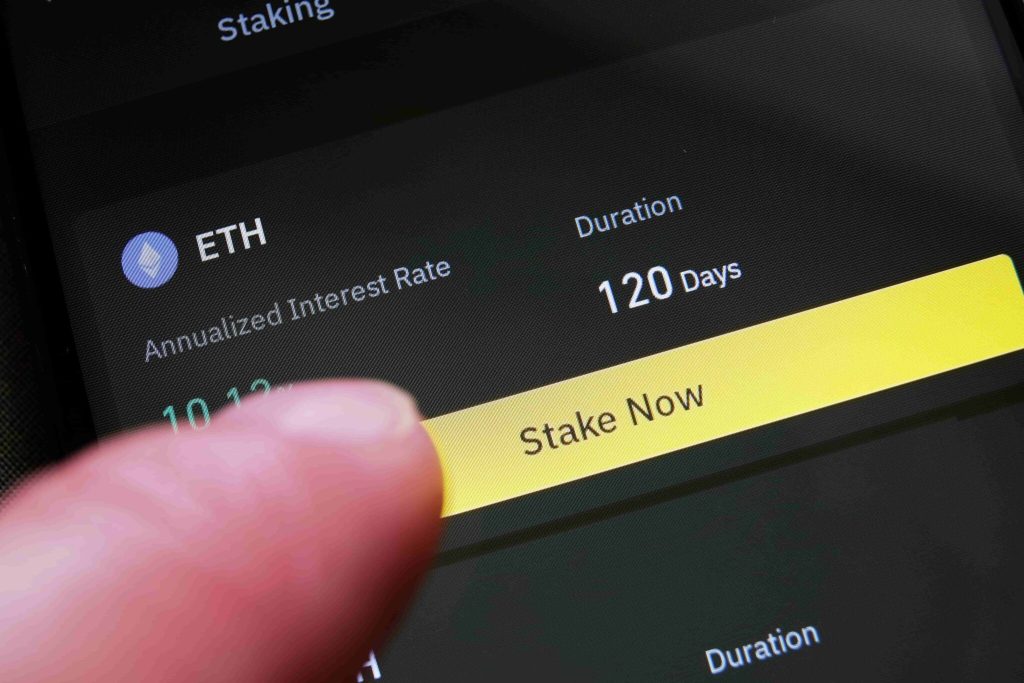
The last week before staking!
⏳ One week away until staking! 🚀
InUnleash the power of $SPONGE staking and watch your rewards flood in! 🧽💦
⏰ Staking goes live on November 1st
Don’t miss out! ⏰🔥#SpongeStaking #Countdown #Alts pic.twitter.com/AryzP8cdid
— $SPONGE (@spongeoneth) October 25, 2023
Invest in the hottest and best meme coin. Buy Sponge ($SPONGE) today!