SPONGE/USD ($SPONGE) Finds Support at $0.00009 as Bulls Eye a Reversal
Estimated Reading Time: 3 minutes
Don’t invest unless you’re prepared to lose all the money you invest. This is a high-risk investment and you are unlikely to be protected if something goes wrong. Take 2 minutes to learn more

SPONGE/USD has continued to test the potential for a rebound at the $0.00009 support level, following a significant bearish breakdown below the critical $0.0001 mark. Although recent price action may appear muted, underlying technical signals point to the possibility of an impending reversal.
The market currently appears to be in an accumulation phase, with informed investors quietly positioning ahead of a potential upward breakout. If bullish sentiment builds, a notable price recovery from this support level could soon unfold.
Key Technical Levels to Watch
- Resistance Levels: $0.000115, $0.000120, $0.000130
- Support Levels: $0.000090, $0.000085, $0.000080
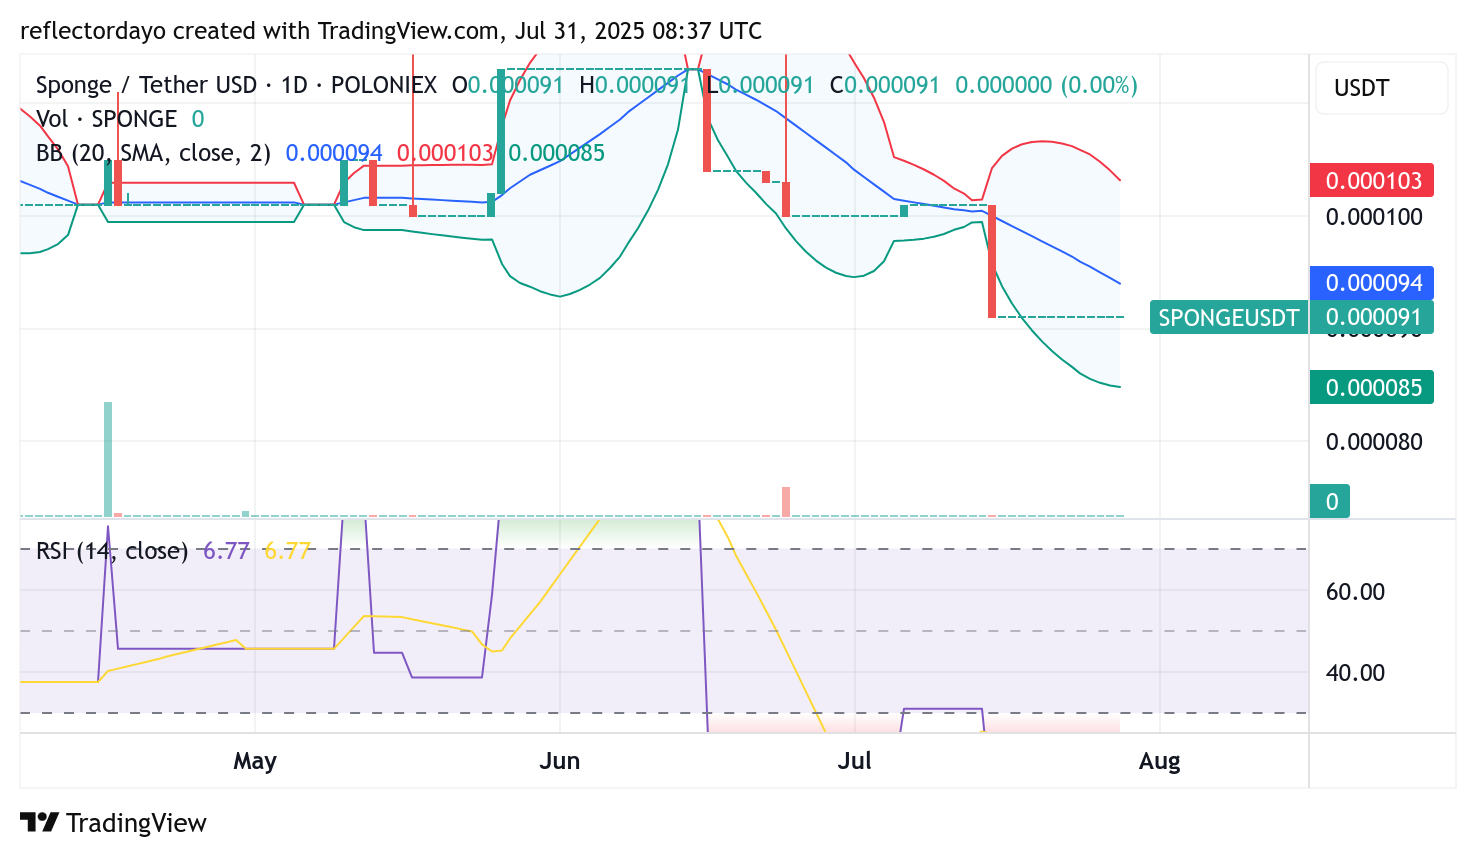
SPONGE/USD Daily Chart: Oversold RSI Signals Possible Reversal Opportunity
On the daily chart, the Relative Strength Index (RSI) continues to linger well below the 30 mark, indicating sustained bearish momentum in recent sessions. This has pushed SPONGE/USD into oversold territory—a condition that often precedes potential market reversals.
Such RSI levels typically prompt traders to consider buying rather than selling, as historical patterns show a tendency for price rebounds following similar setups. With SPONGE/USD currently trading just below the $0.0001 level, the crypto signal is beginning to reflect a classic “buy-the-dip” scenario that could spark renewed bullish interest.

$SPONGE 4-Hour Chart Insight: $0.00009 Support Anchors Ongoing Accumulation
The 4-hour chart shows SPONGE/USD stabilizing around the $0.00009 level, which has consistently served as a strong support zone. Sellers have struggled to push beyond this threshold, leading to a prolonged period of sideways movement—an indication that buyers are gradually accumulating positions.
This repeated defense of support suggests underlying market strength and growing bullish interest beneath the surface. If momentum begins to tilt upward, this accumulation zone could act as a springboard for a short-term breakout to the upside.
Markets getting spicy 🔥💦 pic.twitter.com/CiiWhvewP0
— $SPONGE (@spongeoneth) July 29, 2025
Join the SPONGE community and get in on the next big crypto opportunity! Buy Sponge ($SPONGE) today