SPONGE/USD ($SPONGE) Indicator Suggests Potential Trend Emergence
Estimated Reading Time: 2 minutes
Don’t invest unless you’re prepared to lose all the money you invest. This is a high-risk investment and you are unlikely to be protected if something goes wrong. Take 2 minutes to learn more

From the perspective of the daily chart, technical indicators are beginning to hint at the possibility of a new trend forming in the SPONGE/USD market. For some time, bulls have consistently defended the $0.0001 support level, leading to a prolonged consolidation phase. This sustained standoff has gradually weakened bearish momentum, suggesting that the market may be preparing for a breakout.
Key Levels to Watch
- Resistance: $0.000110, $0.000120, $0.000130
- Support: $0.000090, $0.000085, $0.000080
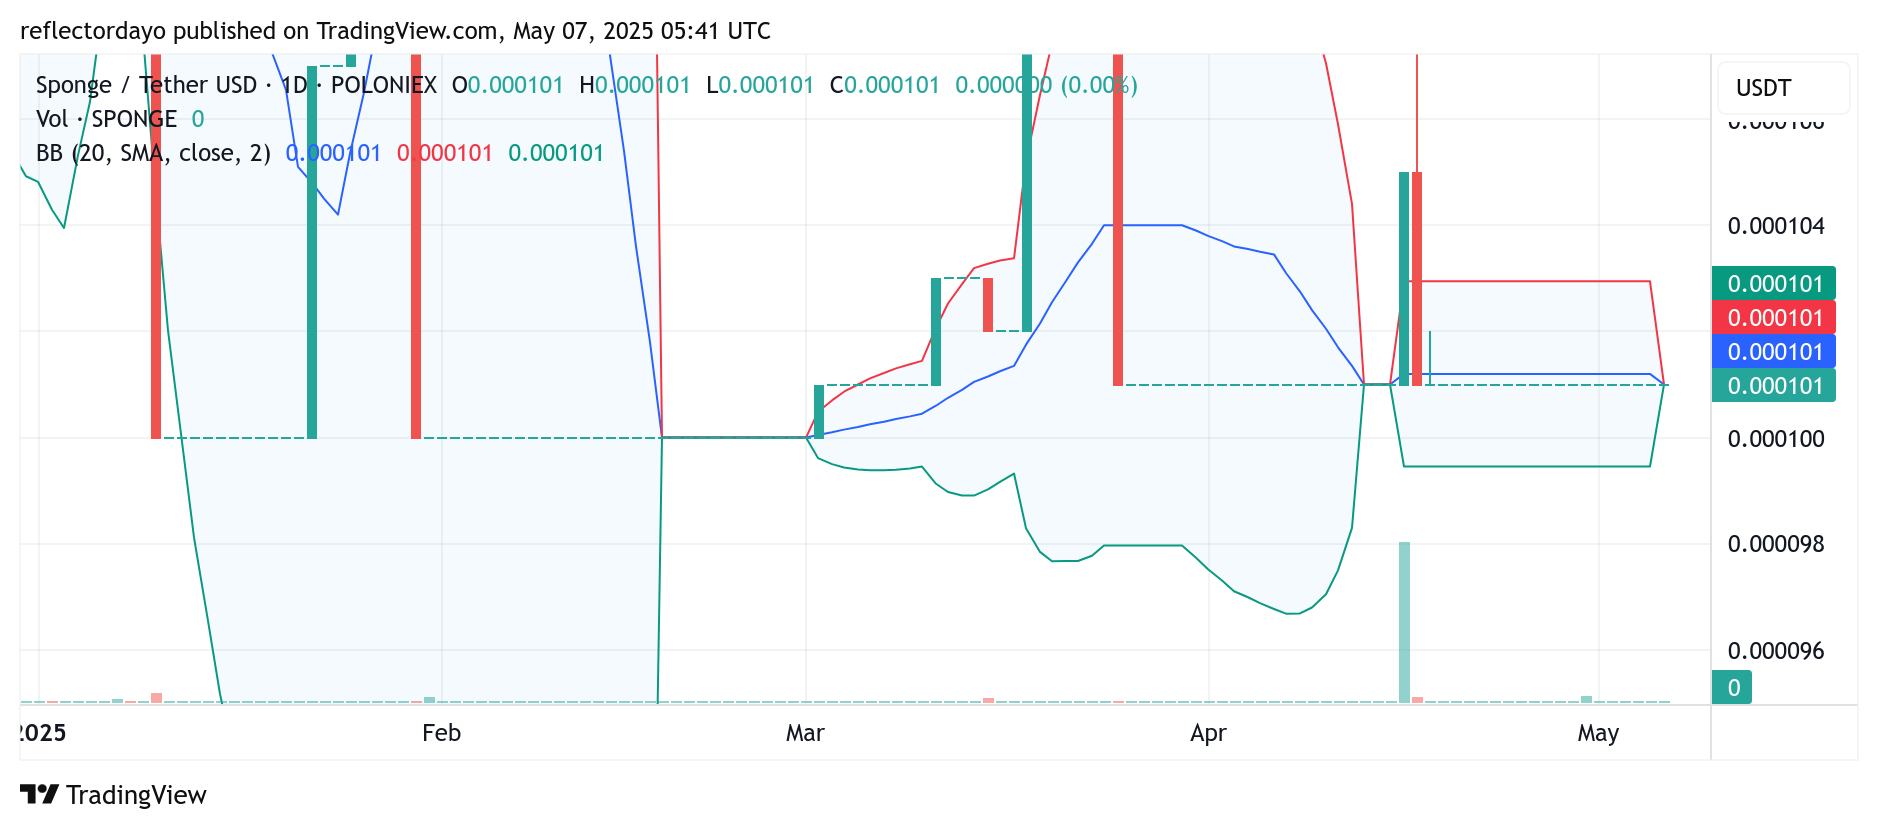
SPONGE/USD Daily Chart Outlook: Volatility Squeeze Hints at Impending Breakout
On the daily chart, SPONGE/USD is exhibiting signs of a potential breakout, as indicated by a sharp contraction in the Bollinger Bands around the $0.0001 price level. This tightening of the bands—commonly referred to as a “volatility squeeze”—signals a period of low volatility following prolonged sideways movement of the crypto signal. The squeeze often follows a phase of intense struggle between buyers and sellers, where neither side gains dominance. As market pressure declines from both directions, this consolidation phase typically precedes a strong directional move, offering early opportunity cues for optimistic traders.
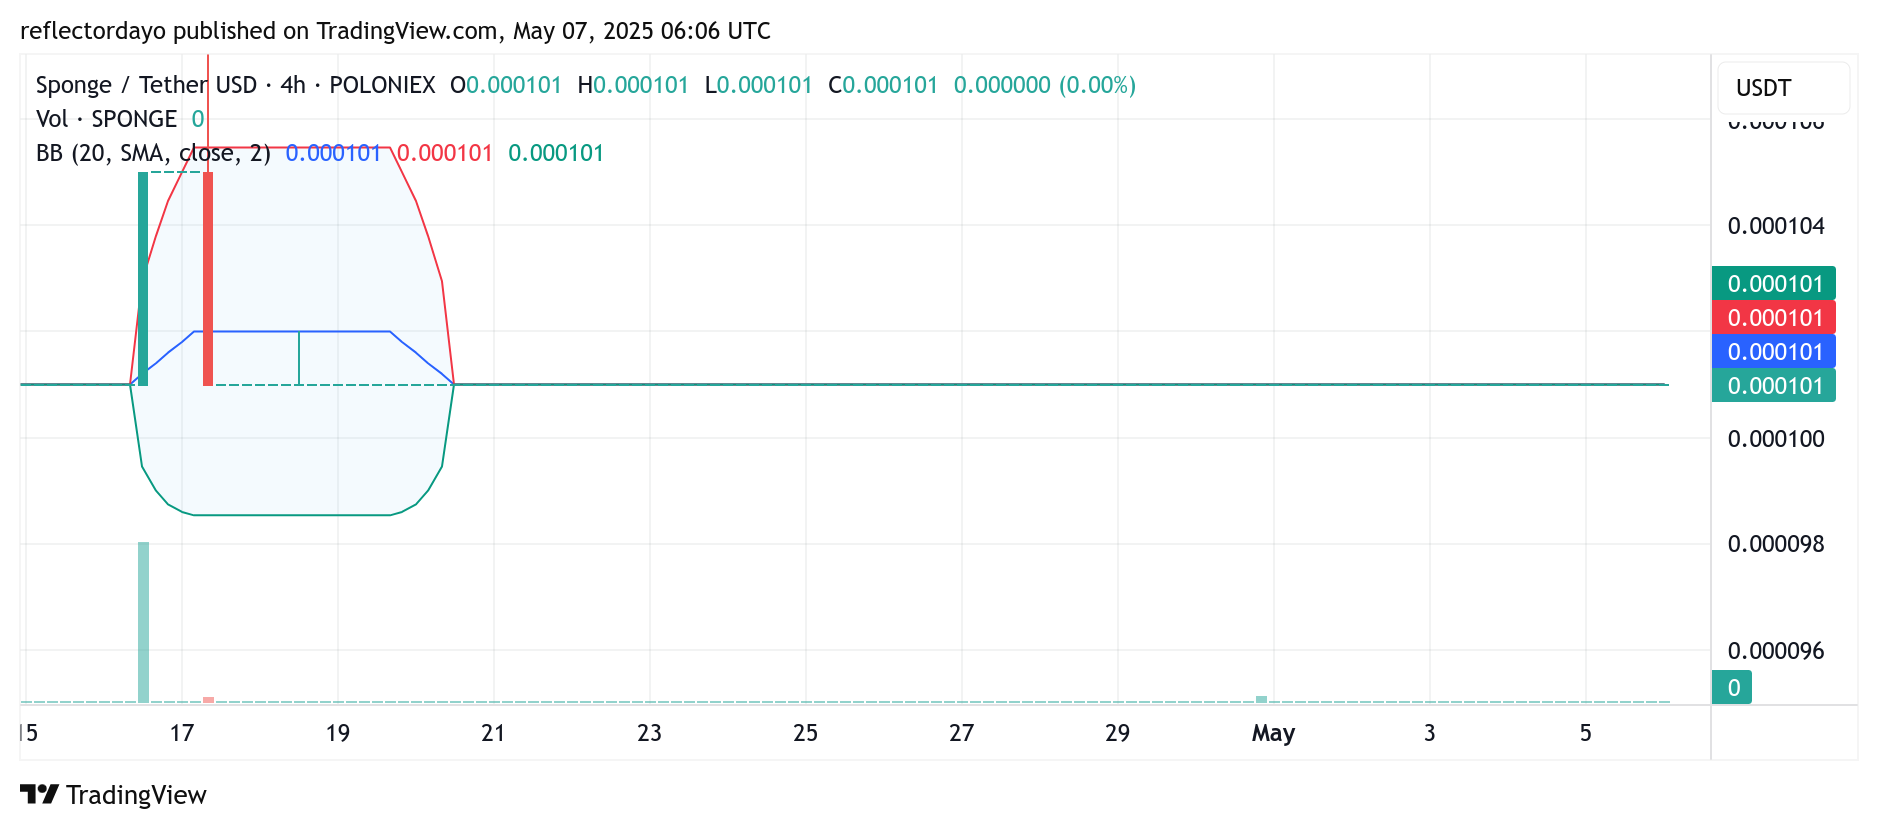
SPONGE/USD 4-Hour Chart: Prolonged Bollinger Band Squeeze Signals Imminent Breakout
While the Bollinger Bands have only recently contracted on the daily chart, the squeeze has been evident for some time on the 4-hour chart. The bands have formed an extremely narrow price channel around the $0.0001 level, reflecting a prolonged period of low volatility and horizontal price movement. This kind of setup typically precedes a sharp breakout in either direction. With pressure building, this may be an opportune moment for traders to consider entering long positions in anticipation of a potential bullish move and favorable returns.
Buy SPONGE/USD!
Don’t be the guy who faded pic.twitter.com/tC1QJmLOkj
— $SPONGE (@spongeoneth) May 2, 2025
Join the SPONGE community and get in on the next big crypto opportunity! Buy Sponge ($SPONGE) today