SPONGE/USD ($SPONGE) Maintains Bullish Momentum with Higher Support Formation
Estimated Reading Time: 4 minutes
Don’t invest unless you’re prepared to lose all the money you invest. This is a high-risk investment and you are unlikely to be protected if something goes wrong. Take 2 minutes to learn more

The $SPONGE market continues to consolidate around a recently formed higher support level, following a sharp retracement from above the critical $0.00011 resistance zone. This consolidation at approximately $0.000104 indicates that bullish sentiment remains intact, with buyers positioning for another potential upward move.
Although the shift from the previous support level may appear marginal, it signals meaningful resilience among optimistic traders. The market’s tendency to oscillate consistently between swing highs and lows adds credibility to the likelihood of a new bounce emerging from this level.
Key Levels to Watch
- Resistance: $0.000115, $0.000120, $0.000130
- Support: $0.000090, $0.000085, $0.000080

SPONGE/USD Daily Chart Outlook: Strengthening Bullish Structure Points to Potential Breakout
The daily chart of $SPONGE continues to build a compelling case for bullish continuation, anchored by the formation of a higher support base near the $0.000104 level. This development follows a healthy correction from above the $0.00011 resistance zone and signals that buyers are regaining control of the market.
The ability of $SPONGE bulls to establish and maintain this elevated base reflects growing confidence among market participants. Instead of falling back to previous lows, price action has stabilized at a slightly higher level, which often serves as a foundation for the next leg upward in trending markets. This higher low structure is a classic indication that demand is increasing and that selling pressure is weakening.
Momentum indicators are also beginning to tilt in favor of buyers. While volume remains moderate, the consistency of support at this level suggests accumulation is taking place. If the bulls manage to build on this base and break above nearby resistance levels, a new rally could be set in motion—potentially targeting the $0.000115 and $0.00012 regions as initial milestones.
Holding the $0.000104 zone is therefore crucial. Not only does it act as a technical launchpad, but it also sends a psychological signal to the crypto market that bulls are prepared to defend territory and drive the price higher. Should this support level continue to hold firm in the coming sessions, traders may begin to price in a breakout scenario.

$SPONGE 4-Hour Chart: Bollinger Band Contraction Signals Potential Accumulation Phase
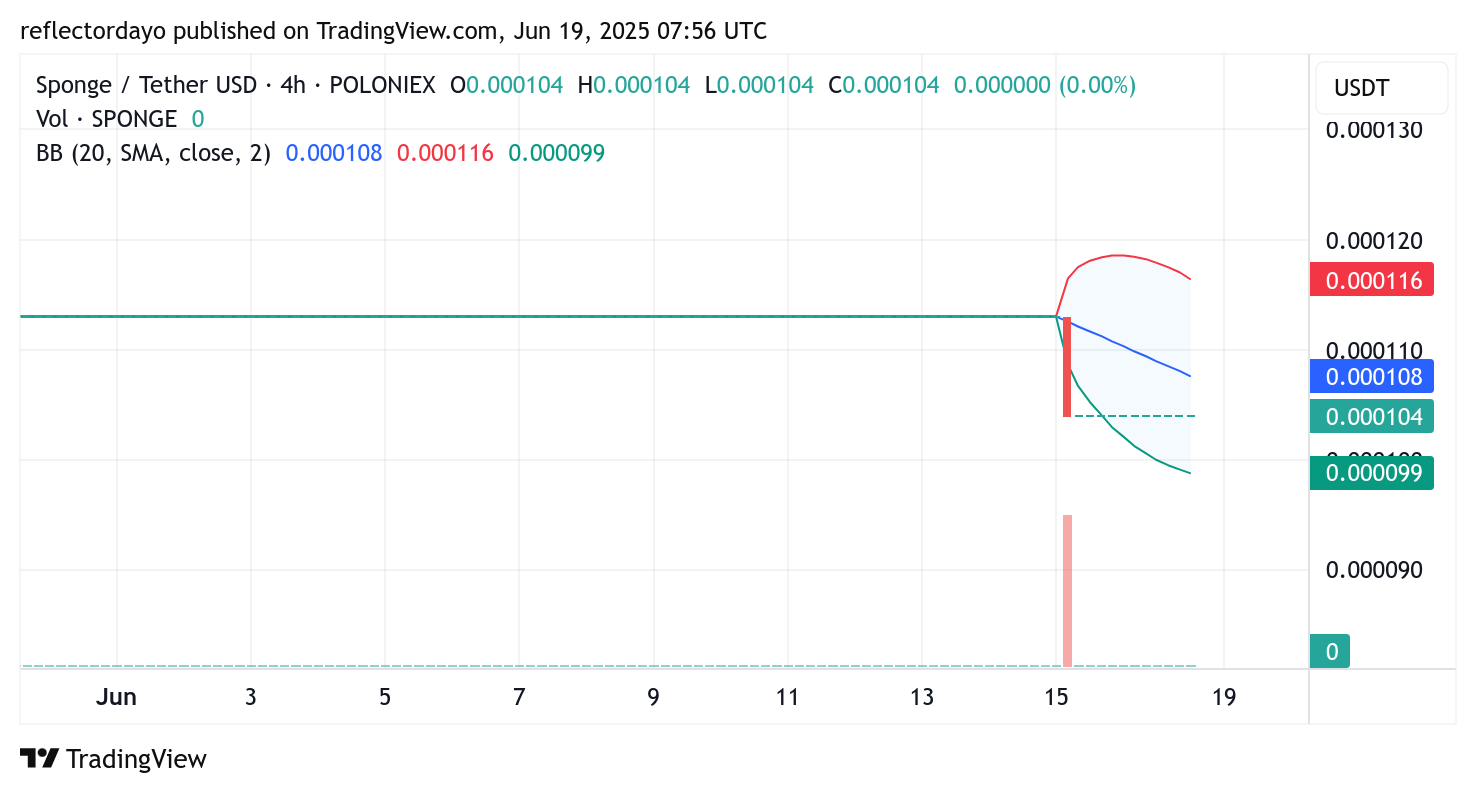
The 4-hour chart for SPONGE/USD reveals that the Bollinger Bands are beginning to narrow, reflecting reduced volatility and the market’s current horizontal price movement. Both the upper and lower bands are gradually converging toward the consolidating price action, which has remained relatively stable around the key $0.000104 support level.
This tightening of the bands typically indicates an impending breakout, as prolonged sideways trading often precedes a strong directional move. With the market caught in a standoff between bulls and bears at this level, the compression in volatility could present an ideal window for accumulation.
If bullish sentiment builds during this low-volatility phase, traders may see a sharp upward breakout as momentum returns. Therefore, continued consolidation near $0.000104—paired with narrowing Bollinger Bands—could be an early sign of a fresh bullish surge on the horizon.
Buy $SPONGE/USD
That feeling when you blow another account. IKYK. 💦 pic.twitter.com/PlsEkis7qx
— $SPONGE (@spongeoneth) June 13, 2025
Join the SPONGE community and get in on the next big crypto opportunity! Buy Sponge ($SPONGE) today