SPONGE/USD ($SPONGE) Rally: Will Bulls Hold Ground Above $0.000105?
Estimated Reading Time: 3 minutes
Don’t invest unless you’re prepared to lose all the money you invest. This is a high-risk investment and you are unlikely to be protected if something goes wrong. Take 2 minutes to learn more

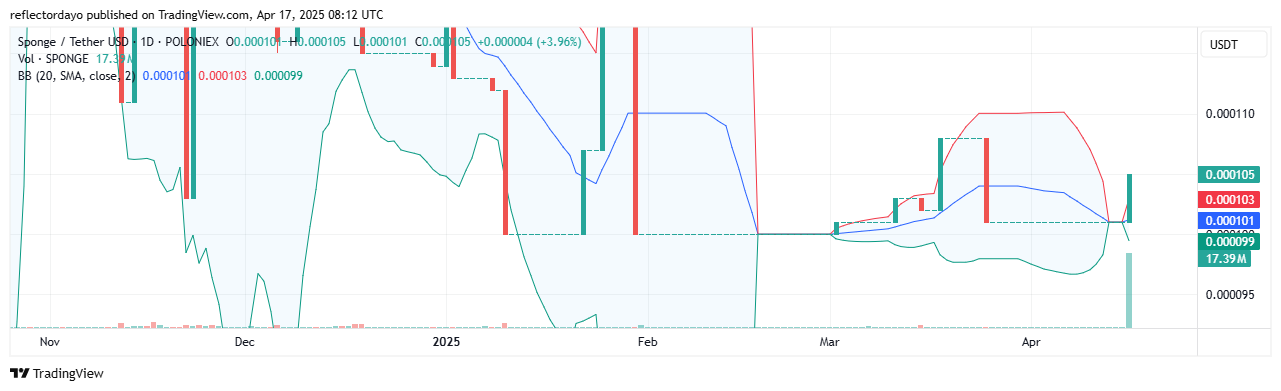
In our earlier market insight, we highlighted a potential bullish setup emerging on the $SPONGE daily chart. At that time, price activity hovered around the $0.0001 support zone, a level that showed resilience against bearish pressure. The structure of the chart indicated an upward move was more likely than a breakdown.
This outlook was further supported by the tightening of the Bollinger Bands, signaling a period of low volatility and hinting at a probable price breakout. Fast forward to the present; that breakout is unfolding. SPONGE/USD has leaped to approximately $0.000105, validating the bullish scenario.
Now that momentum has kicked in, the challenge for bulls is to sustain upward pressure and keep price action above this crucial threshold.
Key Technical Levels
- Resistance: $0.000110, $0.000120, $0.000130
- Support: $0.000090, $0.000085, $0.000080
SPONGE/USD Outlook: Bullish Energy Builds Following Breakout
Since the latter part of March, $SPONGE has been consolidating near the $0.0001 zone. This quiet accumulation phase provided a strategic entry point for buyers. As the Bollinger Bands narrowed in early April, signs of an impending bullish breakout emerged. That scenario has now been confirmed by recent price action.
Today’s session is marked by the formation of a strong Marubozu candlestick, indicating clear bullish dominance. Alongside this, a notable increase in trading volume adds weight to the breakout’s legitimacy.
Currently, the market sits at $0.000105, a critical pivot level. If bulls can turn this area into a stable support, it could form a solid base for further upward expansion.
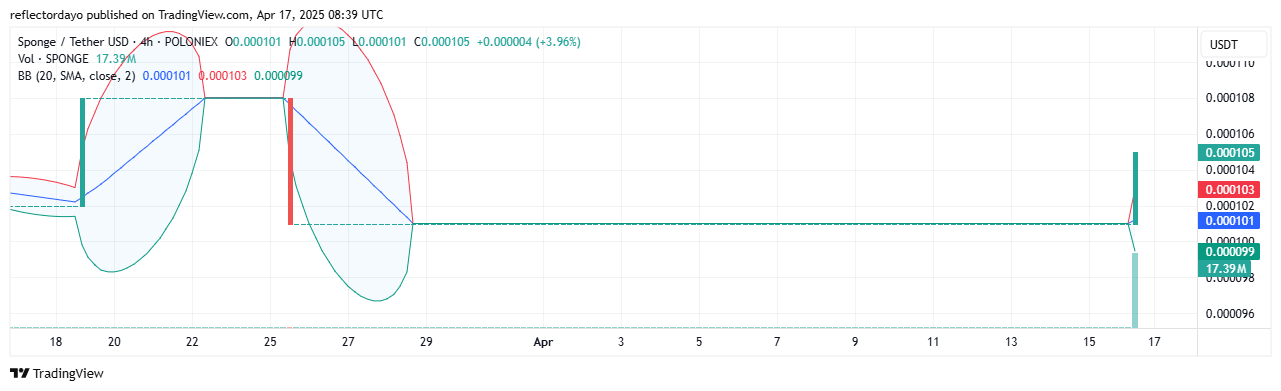
SPONGE/USD 1-Hour Chart: Signs of Short-Term Consolidation Near Resistance
On the 1-hour chart, SPONGE/USD is now trading at a key resistance point around $0.000105. This zone may serve as a battleground between buyers and sellers, potentially triggering a consolidation phase.
Historically, after strong bullish surges, markets tend to cool off with brief sideways moves rather than sharp pullbacks—especially when bullish sentiment remains intact. Should buyers continue to assert control around this level, it may pave the way for another leg up in the market’s trajectory.
Buy $SPONGE/USD!
How the markets be looking at my meme coin portfolio pic.twitter.com/t4MjF6WQn3
— $SPONGE (@spongeoneth) April 11, 2025
Join the SPONGE community and get in on the next big crypto opportunity! Buy Sponge ($SPONGE) today

