SPONGE/USD ($SPONGE) Retraces to Key $0.0001 Support, Poised for Bullish Rebound
Estimated Reading Time: 3 minutes
Don’t invest unless you’re prepared to lose all the money you invest. This is a high-risk investment and you are unlikely to be protected if something goes wrong. Take 2 minutes to learn more

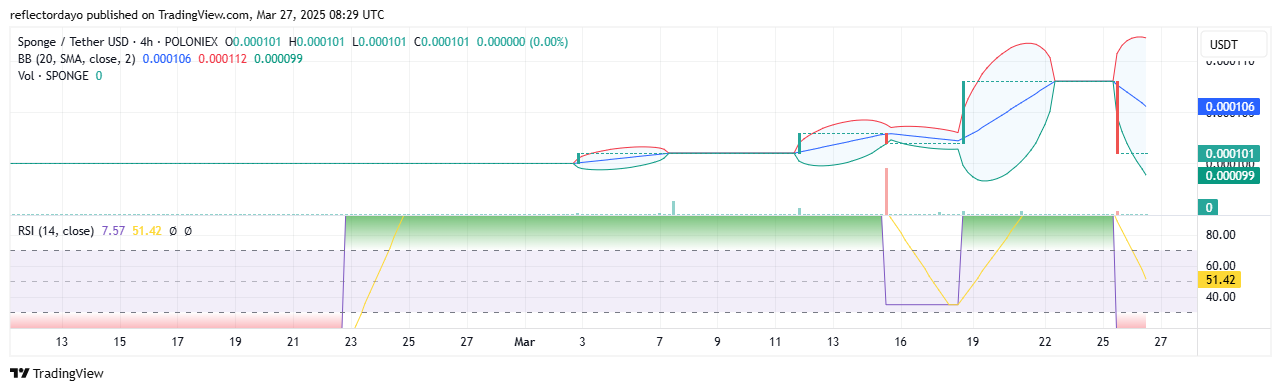
In the latest analysis of the $SPONGE market, the price remains stable, hovering near the critical $0.00011 level. As observed in previous trends, the market experienced a sharp decline from approximately $0.000108, reaching the $0.0001 level. At this point, consolidation resumed, with the price continuing to move sideways.
Given the market’s recent predictability over the past few days and weeks, it has maintained stable support and resistance levels. Traders can capitalize on this stability by entering buy positions now, aiming to secure reasonable profits when the price rises.
Key Levels to Watch
- Resistance: $0.000110, $0.00012, $0.00013
- Support: $0.000090, $0.0000850, $0.00008
SPONGE/USD ($SPONGE) Market Outlook: Technical Indicators Point of View
The $SPONGE Trade Volume Indicator displays small histograms, with occasional significant ones scattered along the line, indicating low trading activity in the market. However, there is no complete lack of trader interest, as periodic surges in trading activity lead to notable market movements.
Currently, the market is consolidating around the $0.0001 price level, while the Relative Strength Index (RSI) signals an oversold condition due to the sharp bearish move that pushed the market into this state. This suggests that a rebound—a rally toward $0.00011—is likely. However, to break out of the horizontal price channel, even though it is relatively wide, the bulls need a strong support level closer to $0.00011.
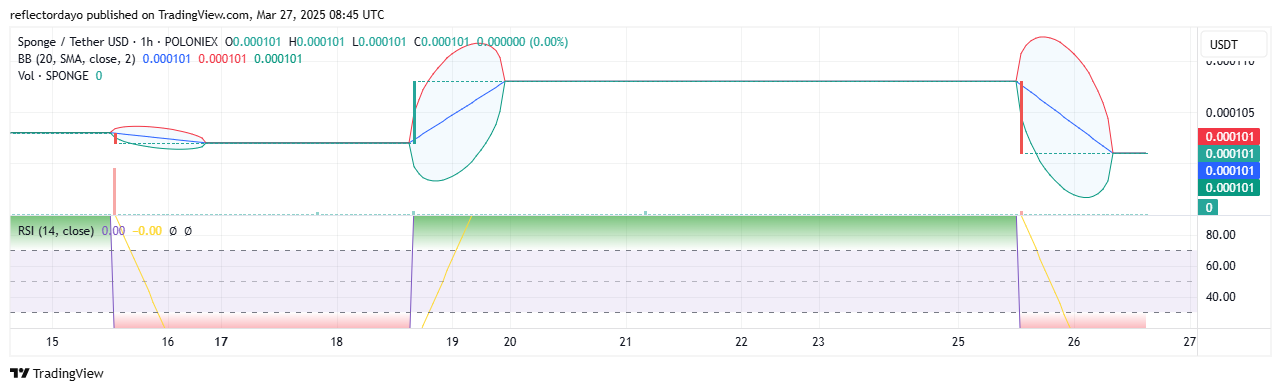
SPONGE/USD 1-Hour Chart Insights
In the 1-hour chart outlook, the Bollinger Bands are converging sharply into a narrow price channel, encapsulating the horizontal price movement. This signals the potential for a strong price breakout. Additionally, the Relative Strength Index (RSI) indicates an oversold market condition, which is likely to trigger a bullish bias. Given that the market is oversold and the price is at a key support level, a rebound is highly probable.
Buy SPONGE/USD!
The mind of an average crypto trader pic.twitter.com/87N2sFbz1j
— $SPONGE (@spongeoneth) March 25, 2025
Join the SPONGE community and be part of the next big crypto sensation! Buy Sponge ($SPONGE) today!