SPONGE/USD ($SPONGE): The $0.00014 Price Continues to Be a Strong Fortress for the Bulls
Estimated Reading Time: 3 minutes
Don’t invest unless you’re prepared to lose all the money you invest. This is a high-risk investment and you are unlikely to be protected if something goes wrong. Take 2 minutes to learn more
The SPONGE/USD market has experienced a consistent support level at $0.00014 since June 20, and the price has repeatedly fallen back to this level during the bear market. Despite several bearish attempts, the market has been unable to break through this support level, indicating a strong level of buying interest and demand at this price.
On June 22, there was a bullish move from the $0.00014 support level, resulting in a peak in the market of around $0.000158. However, after reaching this high, bulls were unable to establish a new support level to maintain the new high. This resulted in the shift of the resistance to the $0.0001473 price level.
Key Levels
- Resistance: $0.0004, $0.0045, and $0.0005.
- Support: $0.00015, $0.00014, and $0.00013.
Sponge (SPONGE/USD) Price Analysis: The Indicators’ Point of View
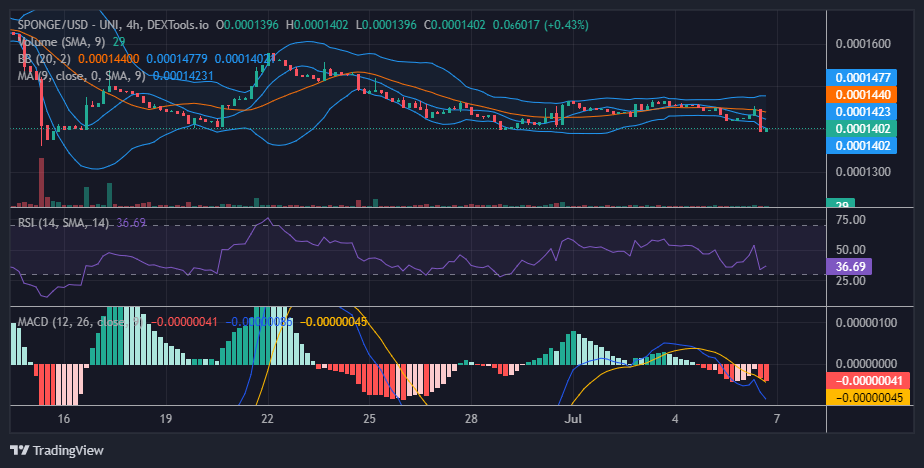
Recent SPONGE/USD candlesticks on a 4-hour timeframe show the market once again falling back to the base, the $0.00014 price level. However, there has been a rebound following this fall, suggesting that buyers are continuing to provide support and preventing the price from dropping further.
From a technical perspective, the repeated tests of the $0.00014 support level and the subsequent rebounds indicate a potential accumulation phase. This suggests that there may be strong buying interest at this level, and traders and investors are accumulating SPONGE tokens at these prices.
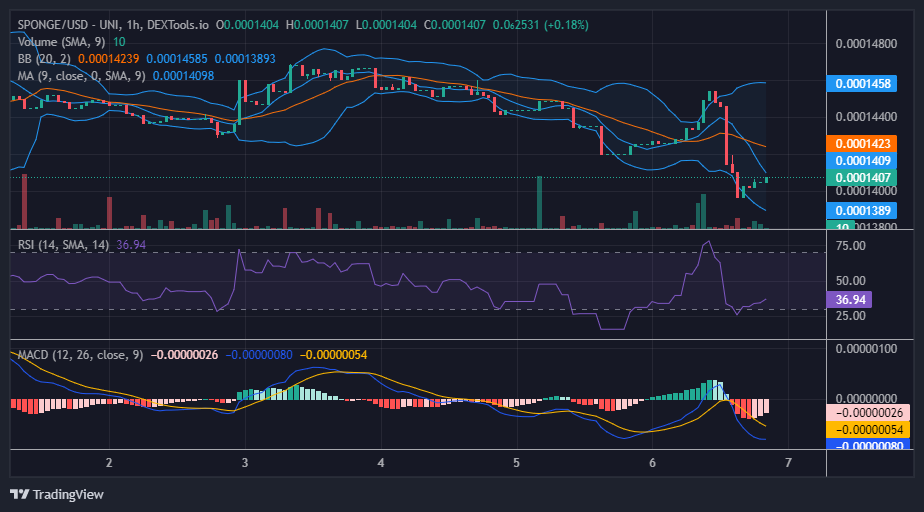
Sponge Short-Term Outlook: 1-Hour Chart
To confirm this bullish bias, it would be important to monitor the price action around the support level. If the SPONGE/USD market continues to rebound and shows strength in holding above $0.00014, it could indicate a potential reversal or continuation of an uptrend.
Analyzing the Volume indicator, scattered large histograms are seen on the chart. Yet, the candlestick representation during those timeframes lacks significance. This indicates a surge in investor interest combined with indecisiveness. These patterns emerge near resistance levels, suggesting bullish attempts for a significant upside breakout.
Don’t pass up the incredible $SPONGE airdrop chance.
Hey #SPONGERS!!!👋🧽
Don’t miss out on the amazing $SPONGE #Airdrop opportunity!🎁🚀
Become a member of our #Discord community and follow the instructions in the airdrop-signup channel to get involved!📋🔗
Get some rewards today!💰💪https://t.co/lzRhjW4oLL pic.twitter.com/4MNbAKXavg
— $SPONGE (@spongeoneth) July 6, 2023
Invest in the hottest and best meme coin. Buy Sponge ($SPONGE) today!