Stellar (XLM/USD) Poised for Uptrend Continuation Above $0.4
Estimated Reading Time: 3 minutes
Don’t invest unless you’re prepared to lose all the money you invest. This is a high-risk investment and you are unlikely to be protected if something goes wrong. Take 2 minutes to learn more
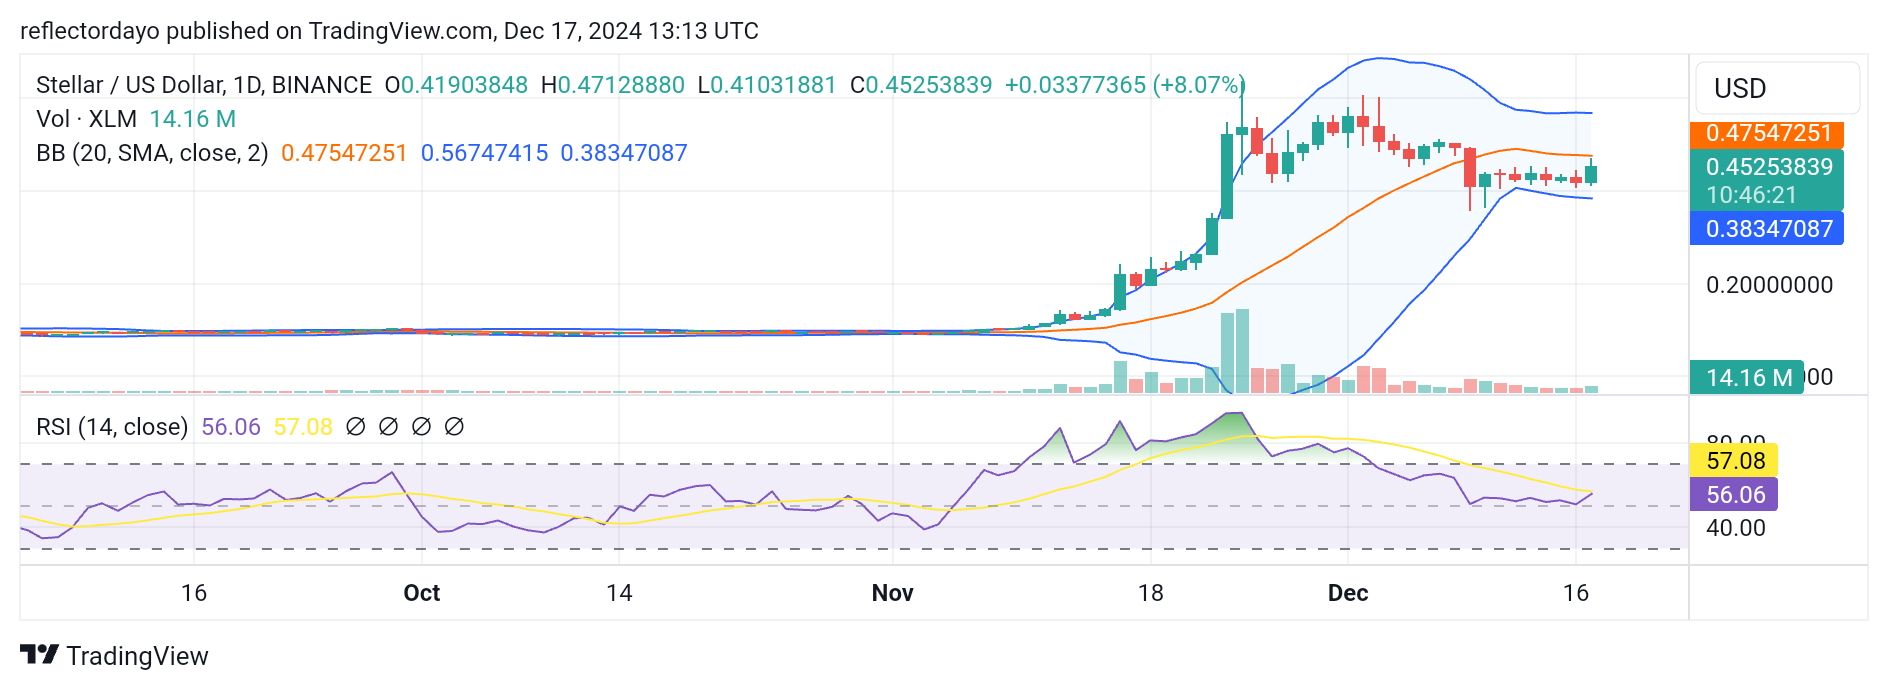
Following a relentless surge in the Stellar market, the price rose from around $0.15, peaking near the $0.6 level toward the end of November. Since early December, bears have started to push the market downward, driven primarily by profit-taking activities after the price surpassed $0.6. However, bulls have since rallied around the $0.4 level, maintaining buoyant market action above this critical support. Today, we observe signs of renewed bullish momentum, as market activity begins to turn to the upside, suggesting a potential upward move driven by increasing buying interest.
Stellar Market Data
- XLM/USD Price Now: $0.29
- XLM/USD Market Cap: $7 billion
- XLM/USD Circulating Supply: 30 billion
- XLM/USD Total Supply: 50 billion
- XLM/USD CoinMarketCap Ranking: #21
Key Levels
- Resistance: $0.50, $0.60, and $0.70
- Support: $0.40, $0.30, and $0.20
Stellar Market Through the Lens of Indicators
The emergence of the $0.4 support level highlights the resilience and determination of the bulls to keep the market upward-bound, as the price consistently rebounded from this threshold. Bullish traders established their stance at $0.4 on December 9 and have successfully maintained their position since then.
In today’s trading session, we observed that the Stellar market is attempting to turn upward, with bullish activity pushing the price further to $0.45. This afternoon, however, price action encountered resistance at $0.47, coinciding with the 20-day moving average. Despite the volume indicator showing a series of small histograms—reflecting limited investor interest over the past few days—today’s session indicates a notable upward push, signaling renewed bullish momentum in the crypto market.
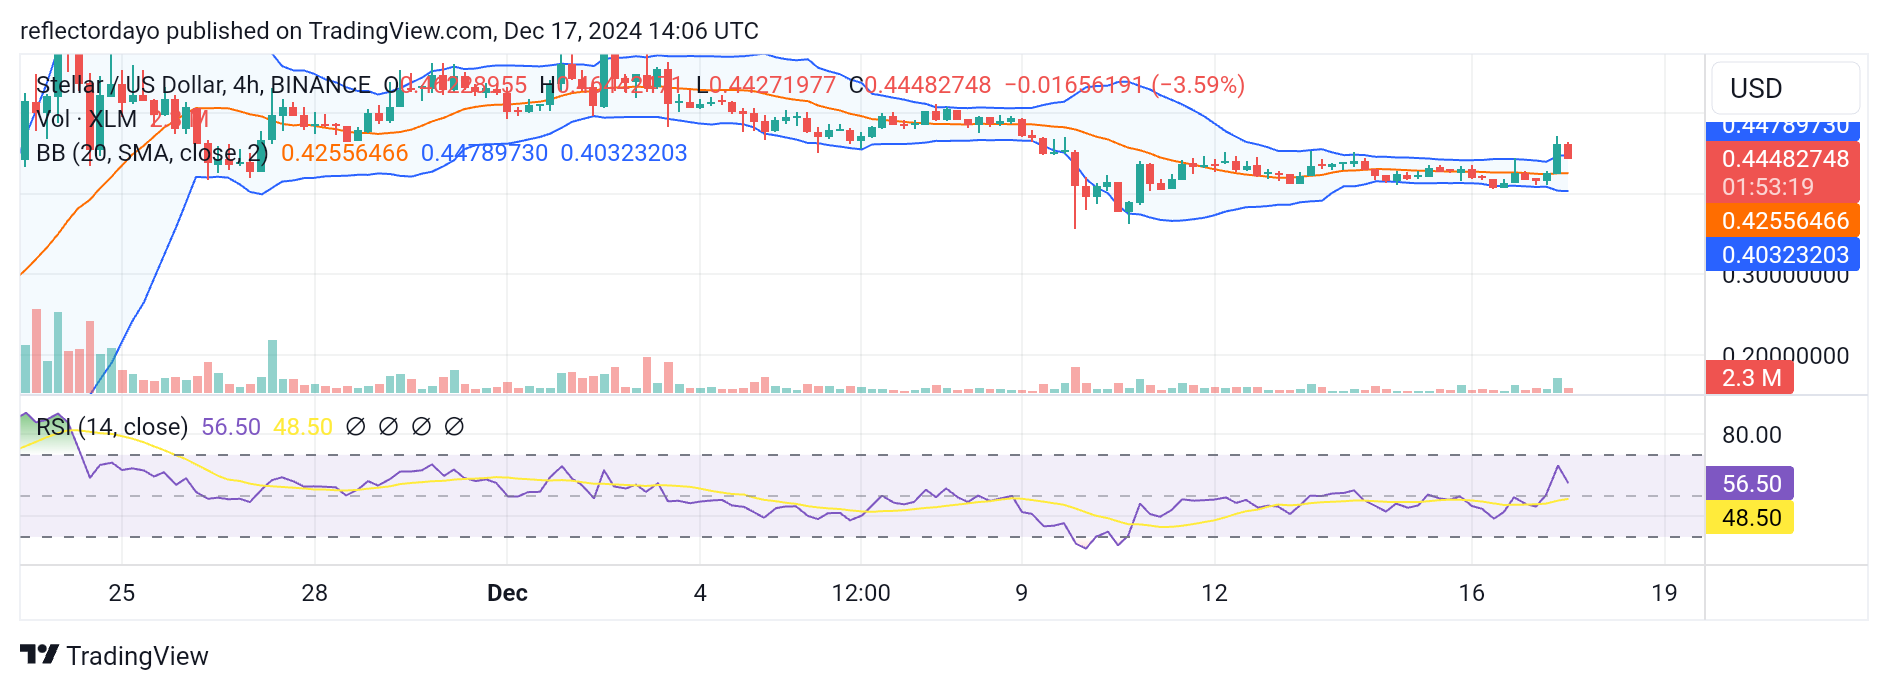
XLM/USD Price Prediction: 4-Hour Chart Analysis
Analyzing the market from the 4-hour chart, which provides a shorter-term perspective, we observe a prolonged struggle between demand and supply. Notably, the volume indicator shows a period of low activity, indicating a phase of consolidation. This suggests that some major investors may have been monitoring this market for a while and could now be attempting to influence a surge upward.
Traders should pay close attention to a potential breakout above the $0.47 level, as such a move could signal the start of a recovery rally and renewed upward momentum.