Tamadoge (TAMA) Still Teeters at $0.001: A Breakout Might Be on the Horizon
Estimated Reading Time: 3 minutes
Don’t invest unless you’re prepared to lose all the money you invest. This is a high-risk investment and you are unlikely to be protected if something goes wrong. Take 2 minutes to learn more

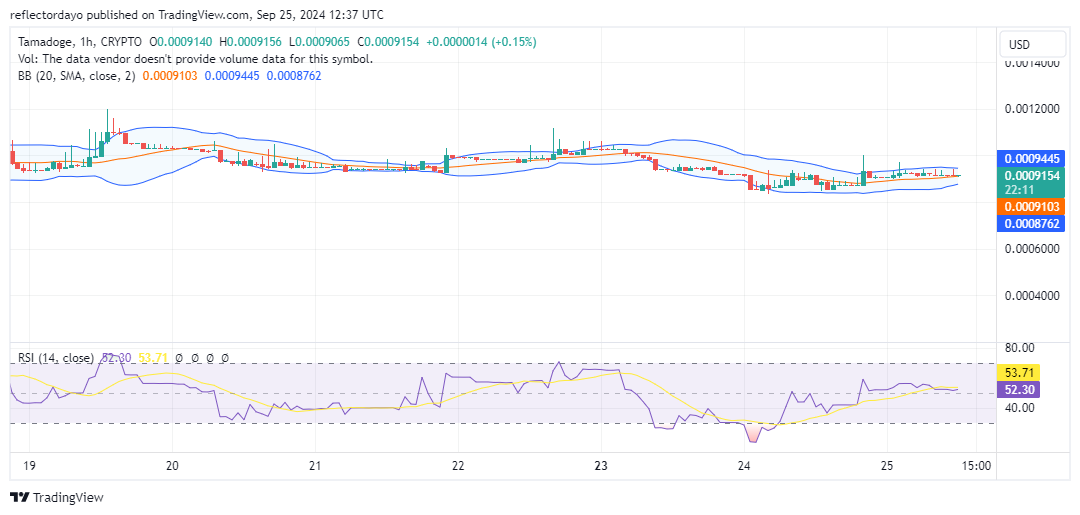
The TAMA/USD market has been trading in a tight range, consistently hovering just below the $0.001 level. This price point has alternated between acting as support and resistance, highlighting the equilibrium between bullish and bearish sentiment. However, recent price movements suggest a potential shift in momentum. The price has shown crypto signal of a slight bullish trend, but it has stalled at $0.000915 as buyers attempt to exhaust the prevailing bearish pressure.
Key Levels
- Resistance: $0.013, $0.014, and $0.015
- Support: $0.0008, $0.00078 and $0.00074

TAMA/USD Price Analysis: The Indicators’ Point of View
The TAMA/USD bulls have made a strong effort to defend the market from falling further below the $0.001 level, with the current price standing at $0.000915. The bears have been building momentum since the high of $0.0026, but bulls have demonstrated resilience, particularly around the $0.0008 support level. The market’s current sideways movement indicates that a breakout could be imminent, though the direction remains uncertain. The bulls’ defense around $0.0008 has been impressive, preventing a deeper decline. Ultimately, if the bulls maintain their strength, they may wear down bearish pressure, potentially leading to a significant breakout.
Tamadoge Short-Term Outlook: 1-Hour Chart
The 1-hour chart shows that after reaching the $0.001 level, the market experienced a correction, with the price pulling back. This correction appears to be nearing completion at $0.000915, where price action has flattened, aligning closely with the 20-day moving average. This suggests that a breakout could be imminent. Additionally, the Bollinger Bands are converging, reflecting the ongoing tug-of-war between demand and supply. This type of market behavior typically precedes a significant breakout—potentially, in this case, an upward one.
Buy Tamadoge!
There’s no mobile runner out there quite like #TamadogePursuit! 🏃♂️
1️⃣ Sign up – start with 20 free credits for a boost!
2️⃣ Climb up the leaderboards.
3️⃣ Win $TAMA rewards!Play Now! 👇
📱Android: https://t.co/Of8SYALRzL
📱 iOS: https://t.co/IthvqovwAH pic.twitter.com/84HNqob9Rf— TAMADOGE (@Tamadogecoin) September 10, 2024