Tamadoge (TAMA/USD): A Tug-of-War Between Bulls and Bears
Estimated Reading Time: 3 minutes
Don’t invest unless you’re prepared to lose all the money you invest. This is a high-risk investment and you are unlikely to be protected if something goes wrong. Take 2 minutes to learn more
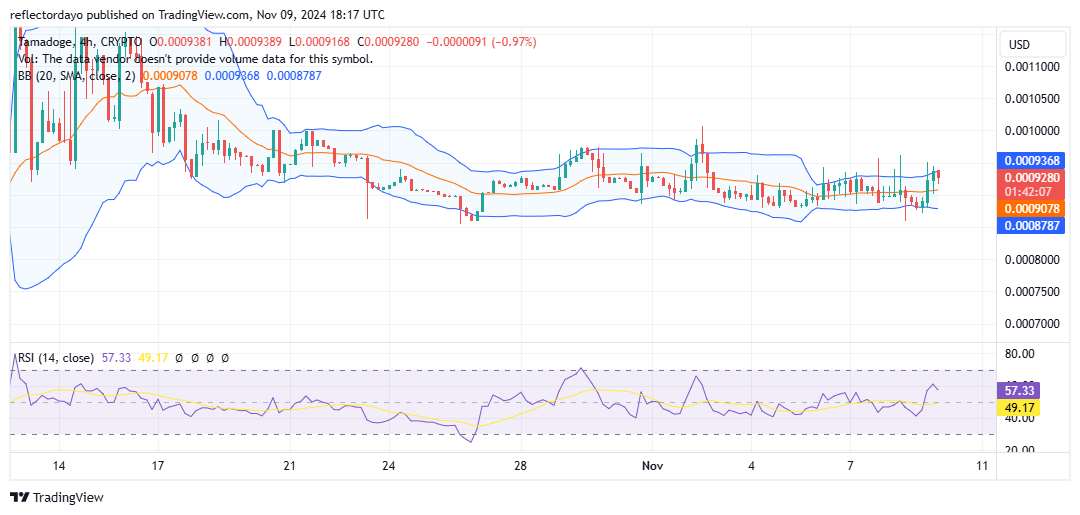
The TAMA/USD market has been experiencing a tight contest between bullish and bearish forces, with the price fluctuating between $0.00088 and $0.001. Currently, the bulls have established support around the $0.0009 level, potentially strengthening their position to push the price toward $0.001. Previous analyses highlighted repeated rejections of bullish attempts to break the $0.001 level. However, this new development suggests an increase in buying pressure, which could challenge the resistance at $0.001 and influence the market’s next move.
Key Levels
- Resistance: $0.0013, $0.0014, and $0.0015
- Support: $0.0008, $0.00078 and $0.00074
TAMA/USD Price Analysis: The Indicators’ Point of View
The current TAMA/USD price action indicates a phase of indecision, with buyers and sellers competing for control. However, bulls are displaying notable strength within the horizontal price channel. The recent candlestick movements crossing above the 20-day moving average—a significant bullish crypto signal—are prompting a reaction from the upper standard deviation band. This response suggests a systematic approach by buyers to target the crucial $0.001 price level.
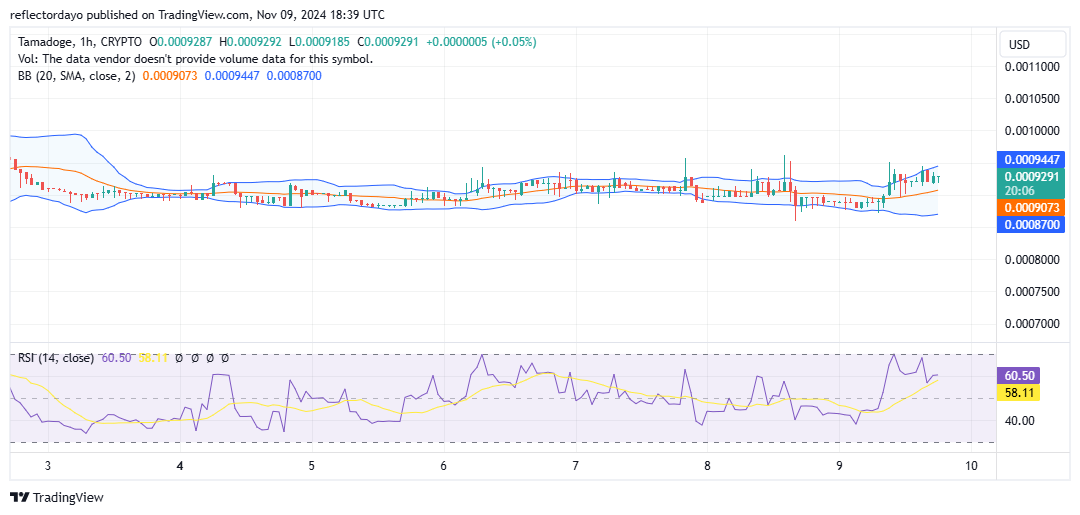
Tamadoge Short-Term Outlook: 1-Hour Chart
On the hourly chart, the market structure suggests a potential breakout, which is also reflected in the 4-hour chart. From this perspective, we observe the emergence of a higher support level at $0.00091. Historically, this level has played a critical role in past price movements, and it now serves as a support that could enable the market to apply pressure on the $0.001 resistance level. Currently, the Relative Strength Index (RSI) indicates potential bullish momentum, with the RSI line holding around 60 for two consecutive sessions. This sustained strength may encourage more traders to adopt bullish positions in anticipation of a breakout above the key $0.001 level.
Buy Tamadoge!
Fill your weekend by playing five exhilarating play-to-earn arcade games! 🕹️💰
Battle your way to the top of the weekly leaderboards and load up on $TAMA rewards!
Download on mobile now 👇
📱 Android: https://t.co/D4TjX7gTFl
📱 iOS: https://t.co/0fjJapf5oA pic.twitter.com/6MCruiKcet— TAMADOGE (@Tamadogecoin) September 13, 2024