Tamadoge (TAMA/USD): Battling for Support at $0.001
Estimated Reading Time: 3 minutes
Don’t invest unless you’re prepared to lose all the money you invest. This is a high-risk investment and you are unlikely to be protected if something goes wrong. Take 2 minutes to learn more
In the Tamadoge (TAMA/USD) market, bearish pressure persists, but bullish momentum remains resilient at the critical $0.001 price level. Despite strong testing by the bears, the bulls have shown determination by pushing the price back upward, striving to sustain the market above this key level as the struggle continues.
The last two trading sessions have been particularly volatile, marked by significant price swings. During this period, bears capitalized on the opportunity to test lower levels, driving the price as low as $0.0008.
Key Levels
- Resistance: $0.0018, $0.0019, and $0.0020
- Support: $0.001, $0.0009 and $0.0008
TAMA/USD Price Analysis: The Indicators’ Point of View
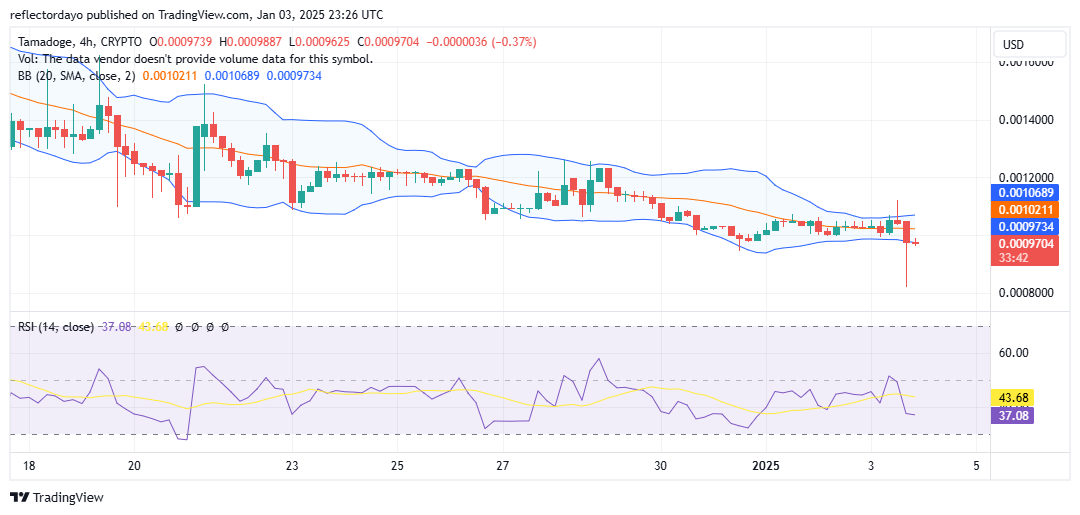
In the previous analysis of the TAMA/USD market, the Bollinger Bands were observed exhibiting what is commonly referred to as a volatility squeeze. This market condition typically precedes a significant price movement.
Upon reviewing the chart, a breakout appeared likely; however, the bulls were unable to sustain the upward momentum. This crypto signal allowed the bears to gain control, pushing the price down to the $0.0008 level before traders stepped in to buy the dip.
Currently, the Relative Strength Index (RSI) indicates that the market is trading below the indicator’s midpoint, reflecting prevailing bearish strength. However, the Bollinger Bands are beginning to react to the recent sharp price movements. This suggests that the bulls have the potential to recover, enabling the market to bounce from its current levels.
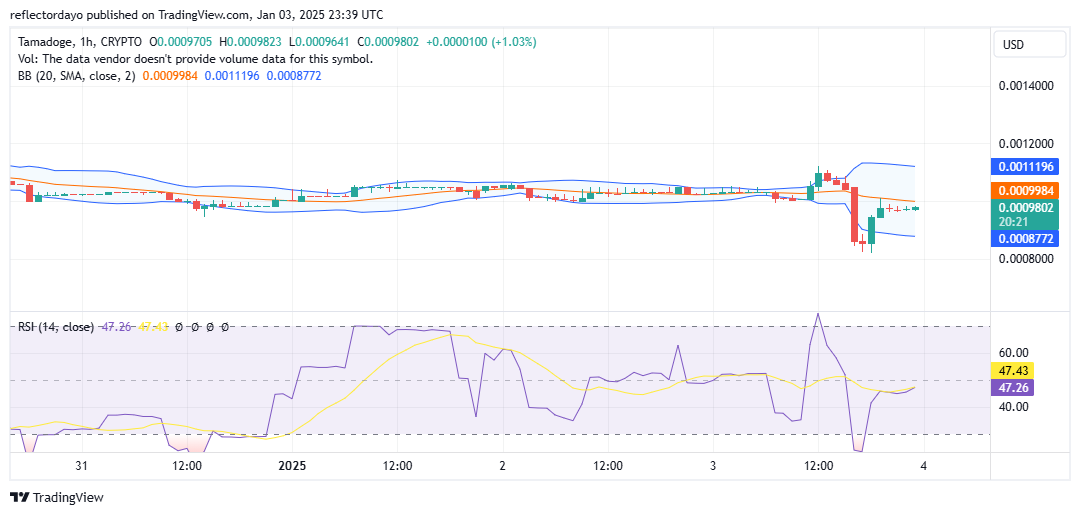
Tamadoge Short-Term Outlook: 1-Hour Chart
The Bollinger Bands display a divergence, signaling an increase in market volatility. However, the positioning of the price action below the 20-day moving average explains why the expanded Bollinger Bands show a slight downward tilt.
Although the price rebounded sharply from the $0.0008 level, it now appears to be consolidating as traders remain indecisive around $0.00098. This indicates that bears may have established control near the $0.001 price level. Nevertheless, given the heightened volatility, the bulls still have the potential to reclaim momentum and push the price above the $0.001 resistance level.
Buy Tamadoge!
Fill your weekend by playing five exhilarating play-to-earn arcade games! 🕹️💰
Battle your way to the top of the weekly leaderboards and load up on $TAMA rewards!
Download on mobile now 👇
📱 Android: https://t.co/D4TjX7gTFl
📱 iOS: https://t.co/0fjJapf5oA pic.twitter.com/6MCruiKcet— TAMADOGE (@Tamadogecoin) September 13, 2024