Tamadoge (TAMA/USD) Charts New Territory After Price Correction: Eyes $0.0054
Estimated Reading Time: 3 minutes
Don’t invest unless you’re prepared to lose all the money you invest. This is a high-risk investment and you are unlikely to be protected if something goes wrong. Take 2 minutes to learn more
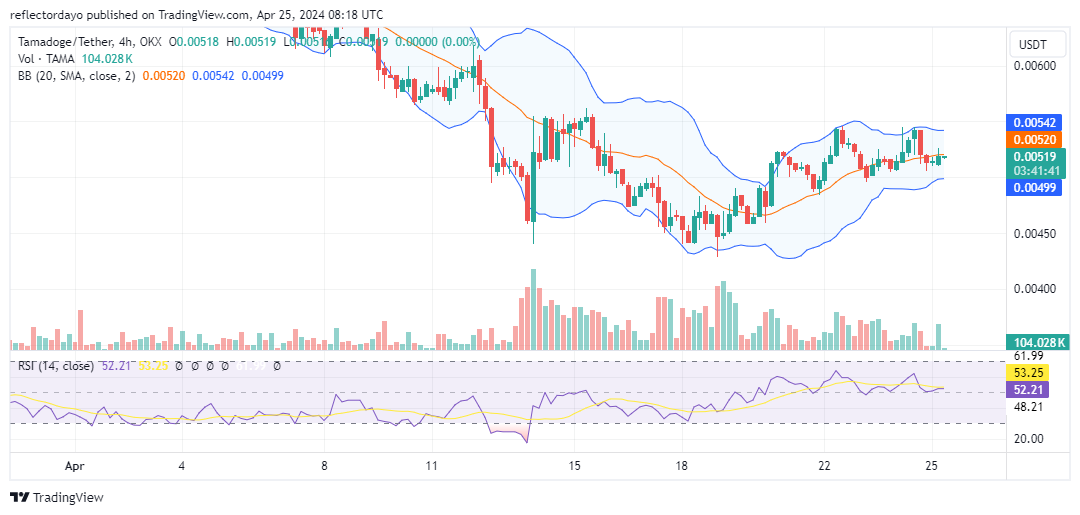
In preceding analyses, we observed the Tamadoge market initiating upward momentum subsequent to finding support near $0.0045. This trend persists, characterized by a succession of higher lows and the breach of the $0.005 threshold. However, this ascent encountered resistance at $0.0054, resulting in dual rejections, notably during a recent four-hour trading session. In reaction, buyers have established firm support around $0.00511, establishing a pivotal level to potentially steer the market towards the $0.0054 mark once again.
Key Levels
- Resistance: $0.013, $0.014, and $0.015.
- Support: $0.0045, $0.0040, and $0.0035.
TAMA/USD Price Analysis: The Indicators’ Point of View
Indicators suggest a potential consolidation phase around the $0.00518 mark. Bollinger Bands shifted from an upward trajectory to a horizontal pattern subsequent to the market’s rejection at the $0.0054 price level, signaling a temporary pause. In our previous analysis, we anticipated traders might establish support at the 20-day moving average, positioned at $0.0052. However, the Tamadoge bulls failed to maintain this level amid bearish pressure, prompting a slight adjustment in support just below this threshold. The Relative Strength Index (RSI) currently hovers slightly above the midpoint, indicating a minor deviation from yesterday’s RSI crypto signal, with bulls making a marginal adjustment of approximately 2 points. Nonetheless, they have yet to exit the equilibrium range.
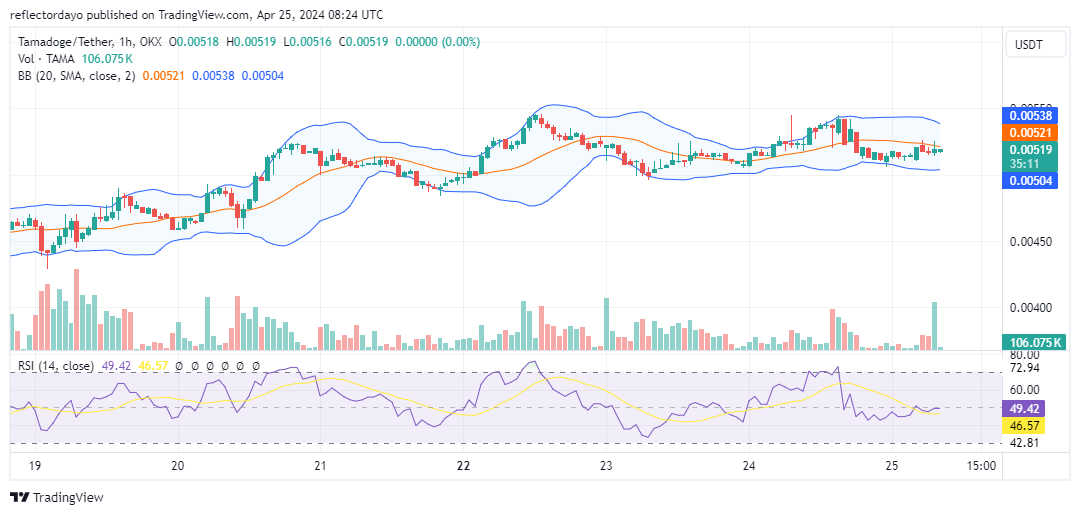
Tamadoge Short-Term Outlook: 1-Hour Chart
Trading volume is declining as the market seeks support at $0.00518, indicating a potential consolidation phase. A breakout above the critical resistance point of $0.0054 could be on the horizon if bulls gain momentum at this level. However, currently, the bulls appear to encounter resistance nearby, approximately around $0.0052. Should demand persistently match supply at this threshold, trading volume may decrease, potentially resulting in a volatility squeeze and paving the way for a robust bullish price movement.
Buy Tamadoge!
The KING is here 🧽🧽💦$SPONGE #Crypto #MemeCoin pic.twitter.com/9N0LScqFKT
— $SPONGE (@spongeoneth) April 24, 2024
Do you want a coin that will be 100 times more valuable in the next few months? That is Tamadoge. Buy TAMA today!