Tamadoge (TAMA/USD) Consolidates Below $0.001, Facing Key Resistance
Estimated Reading Time: 3 minutes
Don’t invest unless you’re prepared to lose all the money you invest. This is a high-risk investment and you are unlikely to be protected if something goes wrong. Take 2 minutes to learn more
Tamadoge (TAMA) has been consolidating just below the critical $0.001 level, potentially indicating an accumulation phase, which has persisted for some time. Recently, there has been a slight increase in bullish activity within the price range of $0.0009 to $0.001. However, this activity has not been strong enough to trigger a significant breakout above the $0.001 resistance. The renewed buying interest around the $0.0009 support level has, however, tightened the trading range.
Key Levels
- Resistance: $0.0013, $0.0014, and $0.0015
- Support: $0.0008, $0.00078 and $0.00074
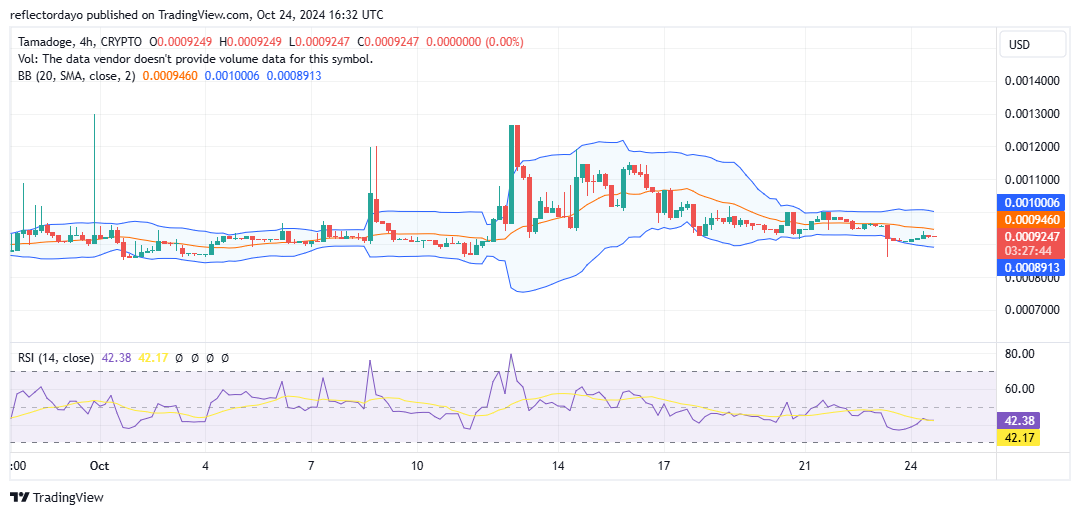
TAMA/USD Price Analysis: The Indicators’ Point of View
The sustained range-bound trading trend suggests a decline in trading volume, likely due to the prolonged tug-of-war between buyers and sellers at this level. Additionally, the narrowing of the Bollinger Bands indicates that the market is trading within a tight range, which often signals an impending breakout or significant move of the crypto market. Recent analysis of the Tamadoge market highlighted a rise in bullish activity; however, strong resistance at the $0.001 level halted this momentum. This was followed by a notable drop in market momentum, causing the price to settle below the 20-day moving average, with less impactful candlesticks characterizing the price action.
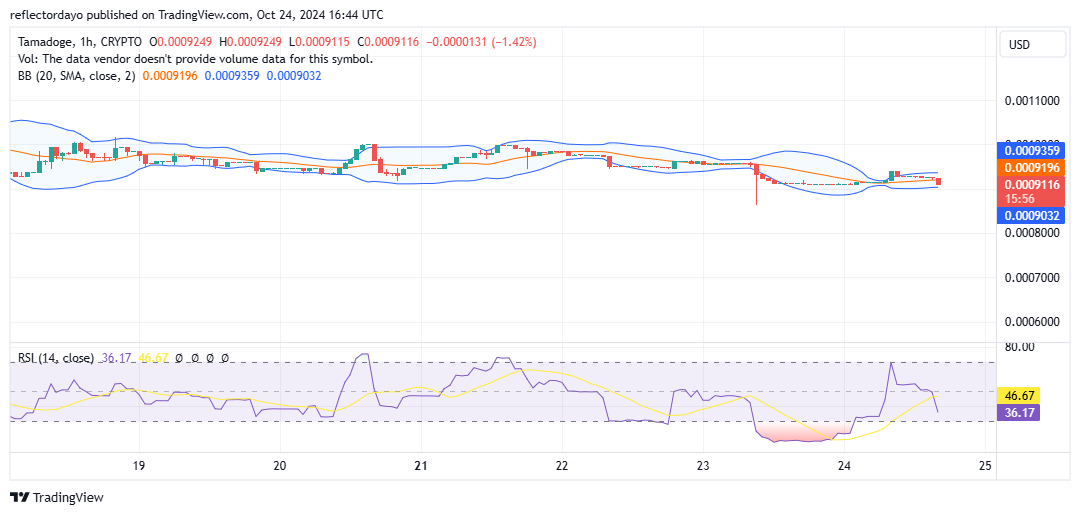
Tamadoge Short-Term Outlook: 1-Hour Chart
A closer examination of the 1-hour chart shows that Tamadoge (TAMA) continues to trade within a range around $0.00092, marked by several four-price dojis. This pattern suggests exhaustion on both the demand and supply sides of the market. However, occasional price spikes within the range indicate moments when traders, whether bullish or bearish, attempt to push the market out of consolidation. For now, it seems this range-bound movement may persist for a while. Meanwhile, the bullish side could be gradually accumulating momentum for an eventual breakout.
Buy TAMA!
Fill your weekend by playing five exhilarating play-to-earn arcade games! 🕹️💰
Battle your way to the top of the weekly leaderboards and load up on $TAMA rewards!
Download on mobile now 👇
📱 Android: https://t.co/D4TjX7gTFl
📱 iOS: https://t.co/0fjJapf5oA pic.twitter.com/6MCruiKcet— TAMADOGE (@Tamadogecoin) September 13, 2024