Tamadoge (TAMA/USD) Initiates Upward Retracement Toward $0.0092
Estimated Reading Time: 3 minutes
Don’t invest unless you’re prepared to lose all the money you invest. This is a high-risk investment and you are unlikely to be protected if something goes wrong. Take 2 minutes to learn more
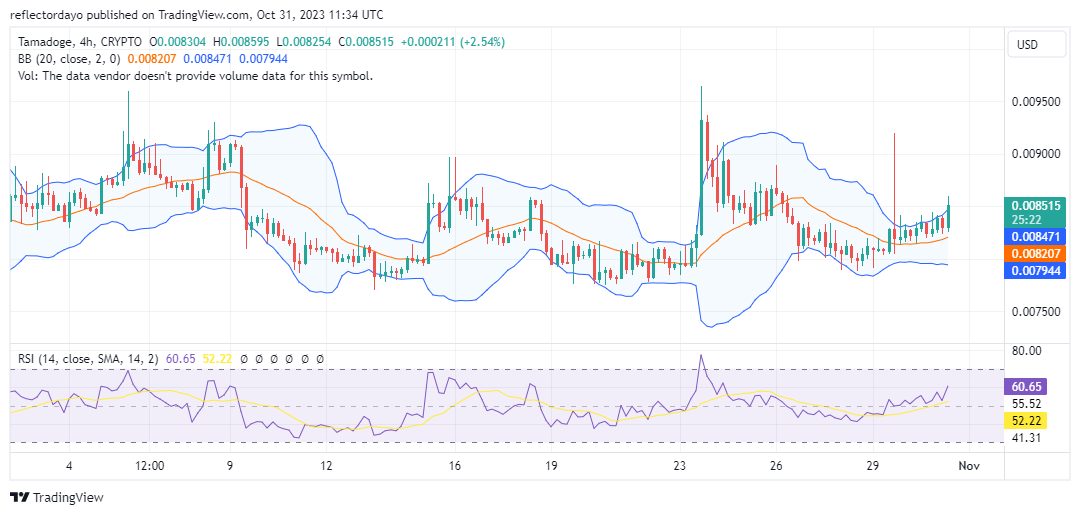
The Tamadoge market has indeed rebounded from the anticipated support level of $0.008 and appears to be exhibiting strong upward momentum. On October 29th, there was a rapid surge in the market, testing the $0.0092 price point, and the current gradual upward price movement may signify a retracement towards this previously tested level.
It’s worth noting that the market is now approaching its first challenge, which is the $0.0085 price level, and the subsequent target will be overcoming the $0.009 price level.
Key Levels
- Resistance: $0.013, $0.014, and $0.015.
- Support: $0.00800, $0.0075, and $0.0073.
TAMAUSD Price Analysis: The Indicators’ Point of View
The Tamadoge market is poised to reach the $0.0085 price level; however, it faces the challenge of confronting a cluster of sell orders above this price point, potentially hindering the bullish momentum. Nevertheless, the market remains determined to achieve its target, underpinned by its robust bullish sentiment.
The Bollinger Bands indicator is exhibiting divergence as the market approaches the pivotal $0.0085 price level, indicating a heightened level of volatility. This increased volatility favors the dominant market sentiment, providing it with the advantage to persevere towards its objective. Should the resistance above this level prove formidable, the bulls may seek nearby support, exerting pressure on the resistance level and potentially leading to a breakthrough.

Tamadoge Short-Term Outlook: 1-Hour Chart
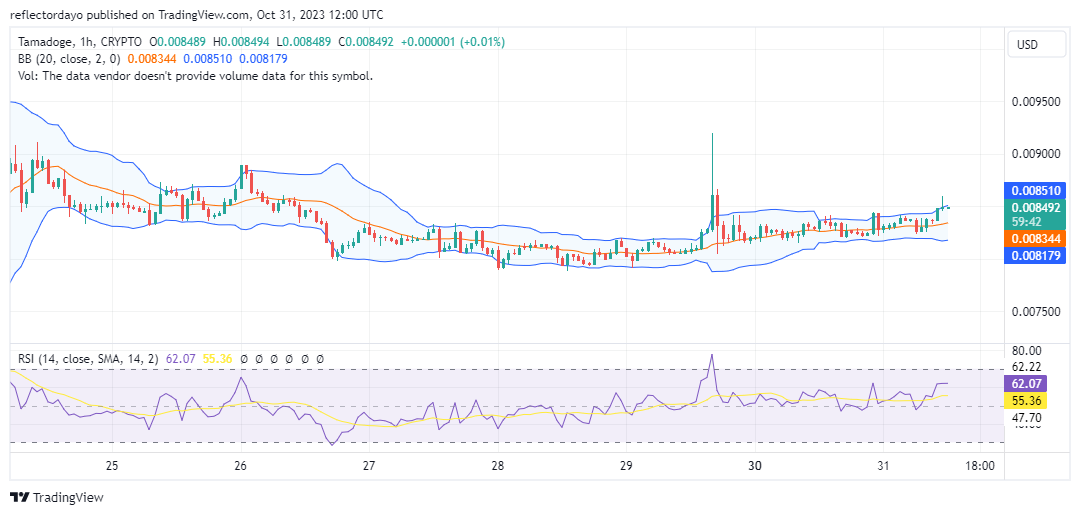
In the 1-hour chart timeframe, the bullish trend is notably prominent. The Bollinger Bands depict an ascending price channel characterized by consistent yet marginally higher lows. However, it’s worth noting that the recent emergence of an inverted hammer candlestick signals formidable resistance above the $0.0085 price level. Presently, a discernible equilibrium exists between supply and demand, potentially leading to a consolidation phase at this juncture. Nonetheless, the diverging Bollinger Bands indicate the likelihood of substantial price fluctuations around this level.
Play Tamadoge on your Android or iOS devices to earn $TAMA.
Stat Attack: Agility 🏃
Run Tama Run! Increase Tamadoge’s agility so you can jump higher speed past your enemies. pic.twitter.com/Ch64SsbXAu
— TAMADOGE (@Tamadogecoin) October 31, 2023
Do you want a coin that will be 100 times more valuable in the next few months? That is Tamadoge. Buy TAMA today!