Tamadoge (TAMA/USD) Market Outlook: Bulls Stand Firm at the $0.00008 Support Zone
Estimated Reading Time: 3 minutes
Don’t invest unless you’re prepared to lose all the money you invest. This is a high-risk investment and you are unlikely to be protected if something goes wrong. Take 2 minutes to learn more
TAMA/USD continues to move sideways as buyers work hard to protect the critical $0.00008 support level following the latest pullback. Although bears briefly managed to push the price downward in recent sessions, the downward pressure quickly faded, and Tamadoge soon returned to the familiar $0.00008 area.
For now, bullish sentiment around this level remains strong. Buyers continue to absorb selling pressure at this key threshold, keeping the broader bullish structure intact. Holding above $0.00008 is crucial for preventing deeper losses and maintaining the possibility of another upside attempt.
Should bulls maintain control and recover momentum, the crypto signal may revisit the upper levels, with the next major target ultimately sitting around the $0.0001 resistance region.
Key Levels to Watch
- Resistance: $0.00020, $0.00030, $0.00040
- Support: $0.000080, $0.000075, $0.000070
Tamadoge (TAMA/USD) Daily Chart Analysis
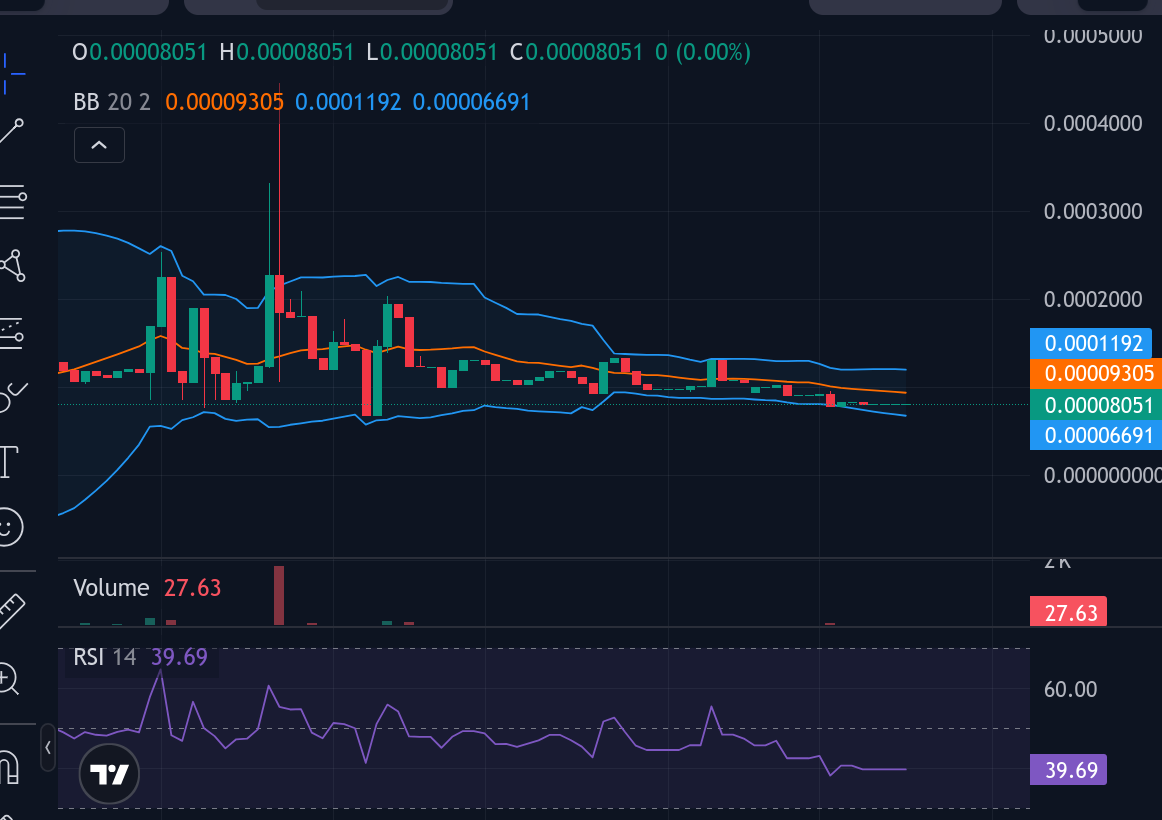
On the daily timeframe, TAMA/USD continues to present a consolidation pattern, even with the recent downward pressure. While sellers have attempted to push the market lower, momentum remains insufficient for a sustained bearish continuation. The repeated formation of doji candles, especially visible on the 4-hour chart, highlights fatigue among sellers.
If the price breaks below the $0.00008 line, this could trigger a move toward the $0.00007 support zone. However, given the current market behavior, a deeper sell-off seems less likely, as the strongest wave of bearish activity has occurred only recently and has not extended aggressively.
How price behaves in the next few sessions will be key. Traders will be watching closely to see whether TAMA builds enough strength for a bounce or if sellers regain control.
TAMA/USD Short-Term (4-Hour) Market Perspective
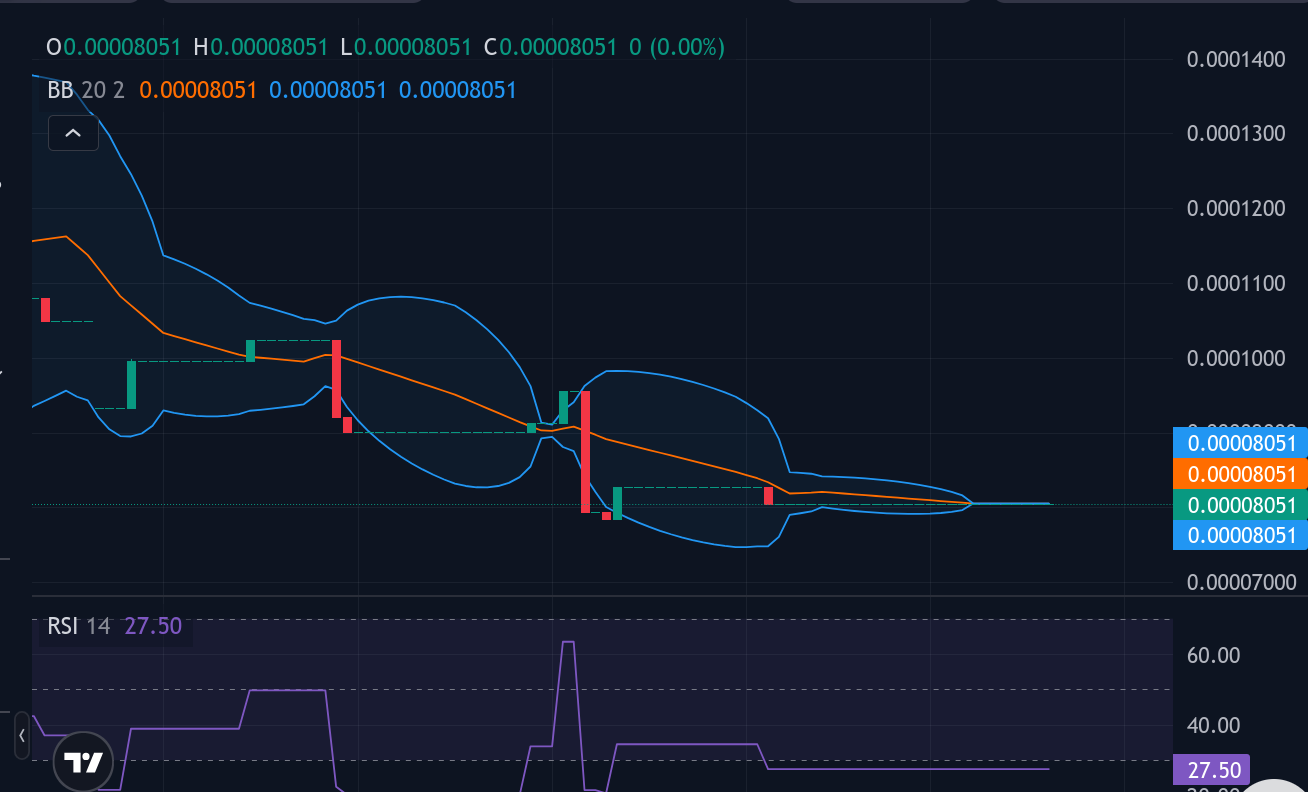
On the 4-hour chart, a cluster of four doji candles following the recent downturn signals diminishing bearish strength. This type of candlestick pattern typically points to indecision and potential exhaustion among sellers.
Furthermore, the RSI remains well within the oversold region—currently near 27—suggesting that the market may be primed for a recovery move.
With bearish momentum stretched and support holding firm, the conditions now favor a possible short-term rebound as buyers gradually begin to re-enter the market.
Buy Tamadoge!
There’s no mobile runner out there quite like #TamadogePursuit! 🏃♂️
1️⃣ Sign up – start with 20 free credits for a boost!
2️⃣ Climb up the leaderboards.
3️⃣ Win $TAMA rewards!Play Now! 👇
📱Android: https://t.co/Of8SYALRzL
📱 iOS: https://t.co/IthvqovwAH pic.twitter.com/84HNqob9Rf— TAMADOGE (@Tamadogecoin) September 10, 2024