Tamadoge (TAMA/USD) Market Stabilizes Near $0.000022
Estimated Reading Time: 2 minutes
Don’t invest unless you’re prepared to lose all the money you invest. This is a high-risk investment and you are unlikely to be protected if something goes wrong. Take 2 minutes to learn more

In the previous analysis, we highlighted how the Tamadoge market broke below the critical $0.00005 price level. Following this breakdown, bearish pressure intensified, but strong bullish sentiment around the $0.000022 level triggered heightened volatility. Despite the turbulence, it is encouraging to see bulls holding firm at $0.000022, successfully rejecting further bearish momentum and stabilizing the market.
Key Levels to Watch
- Resistance Zones: $0.00045, $0.00050, $0.00055
- Support Zones: $0.000022, $0.000021, $0.000020
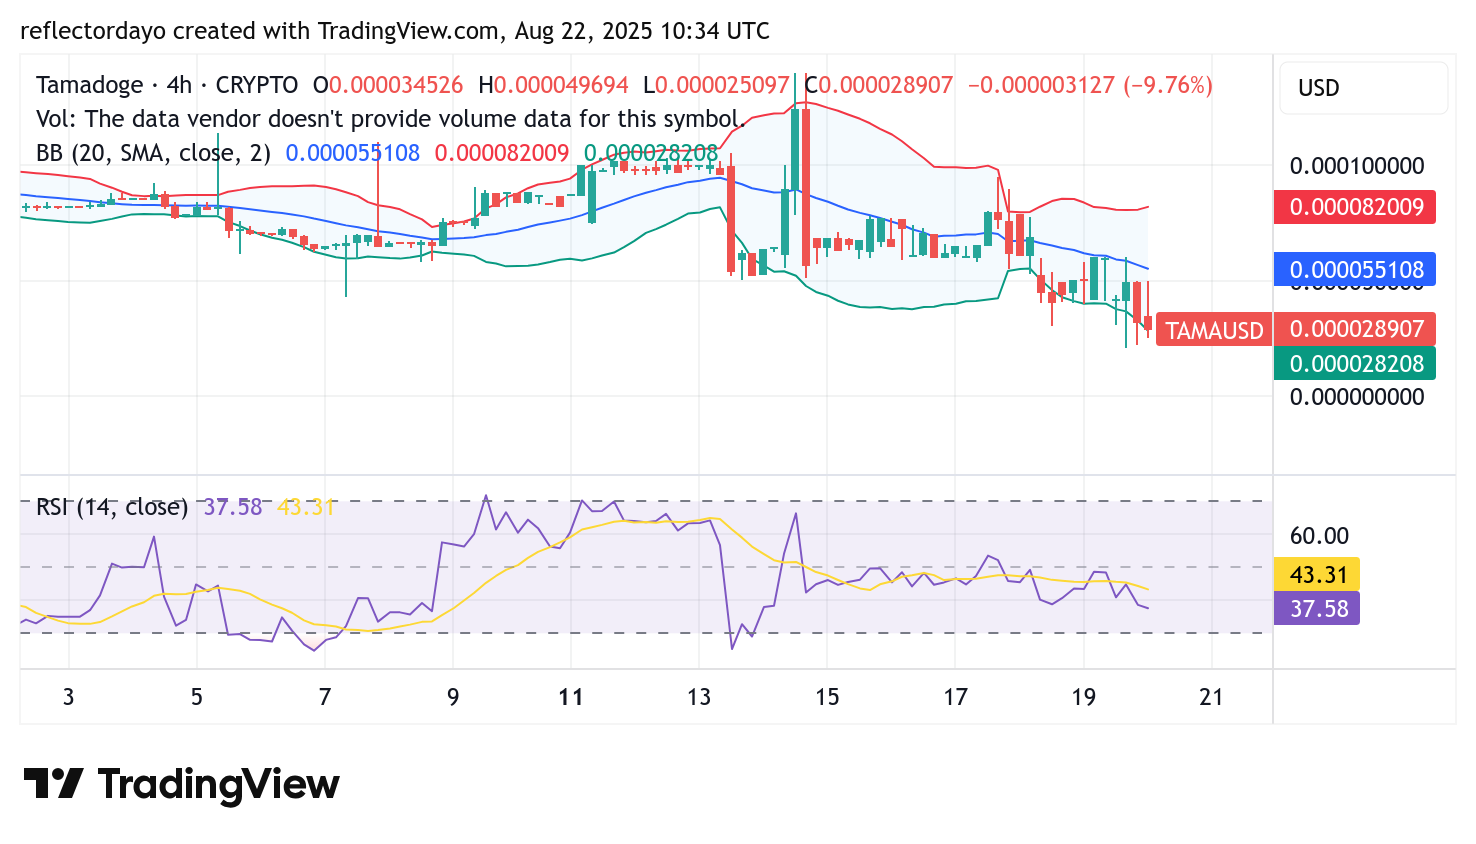
Tamadoge (TAMA/USD) 4-Hour Chart: Bulls Eye Key Rebound Zone
Bearish momentum has dominated the Tamadoge market, driving price action deeper into lower zones and forcing a decisive break below the critical $0.00005 level. However, significant bullish sentiment has emerged near the $0.000022 support area. Repeated rejection of bearish attempts at this key level suggests that the $0.000022 support remains formidable. This resilience increases the likelihood of a bullish reversal, positioning the crypto signal for a potential upside bounce.
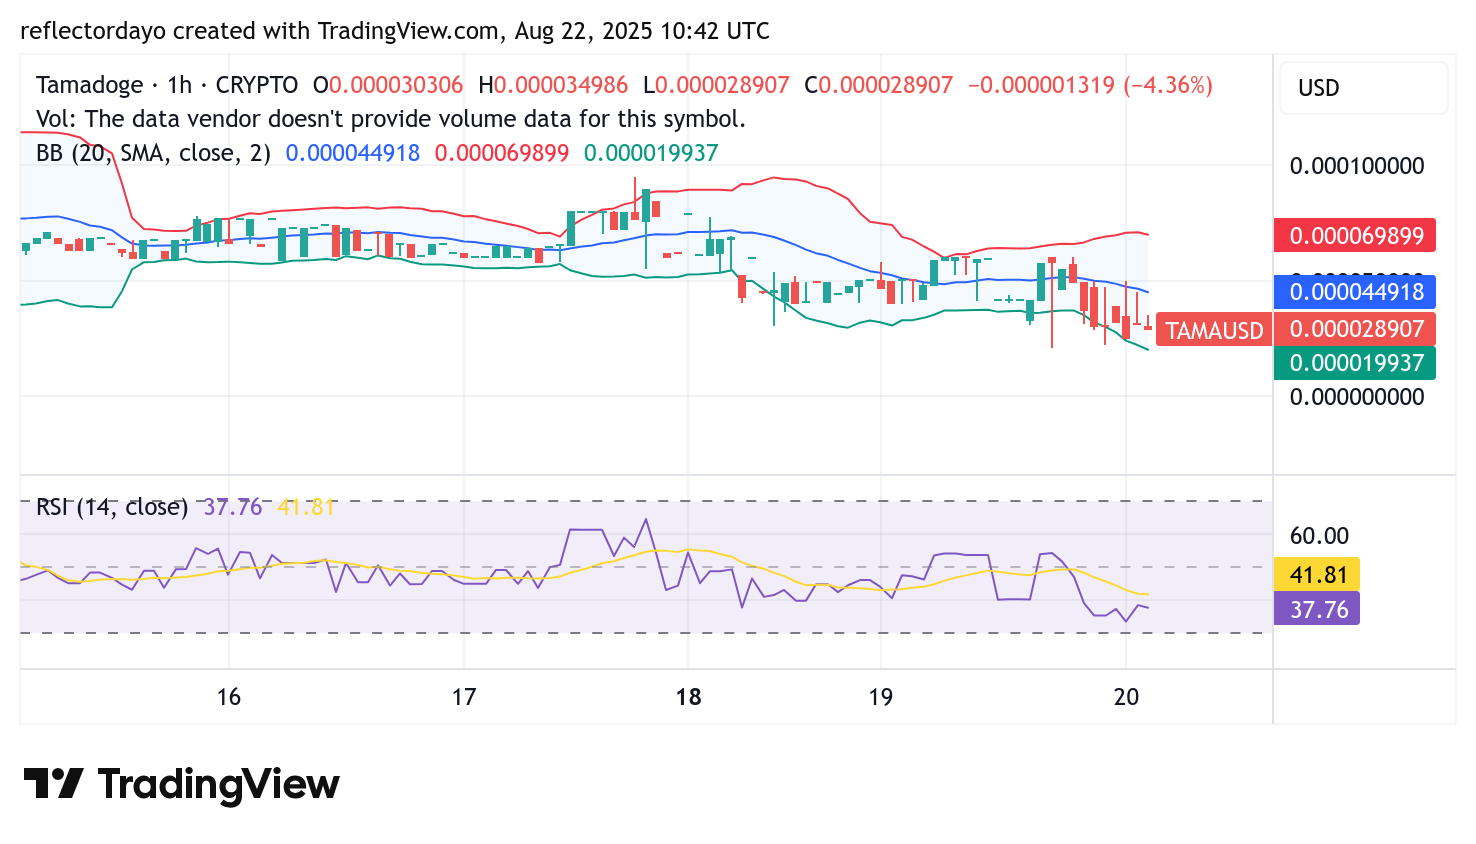
Tamadoge (TAMA/USD) 1-Hour Chart: Bearish Pressure Meets Signs of Exhaustion
On the 1-hour timeframe, Tamadoge continues to trade with heightened volatility, as reflected in the wide spread of the Bollinger Bands. The RSI has shifted bearish, falling below the midpoint and currently hovering near 37—an indication of strong selling pressure. Nevertheless, the emergence of gravestone doji and shooting star candlesticks at these lower price levels suggests that bearish momentum may be waning. This pattern signals potential exhaustion among sellers, raising the prospect of an imminent bullish rebound.
Buy TAMA/USD!
There’s no mobile runner out there quite like #TamadogePursuit! 🏃♂️
1️⃣ Sign up – start with 20 free credits for a boost!
2️⃣ Climb up the leaderboards.
3️⃣ Win $TAMA rewards!Play Now! 👇
📱Android: https://t.co/Of8SYALRzL
📱 iOS: https://t.co/IthvqovwAH pic.twitter.com/84HNqob9Rf— TAMADOGE (@Tamadogecoin) September 10, 2024