Tamadoge (TAMA/USD) Targets $0.0008 for Takeoff
Estimated Reading Time: 3 minutes
Don’t invest unless you’re prepared to lose all the money you invest. This is a high-risk investment and you are unlikely to be protected if something goes wrong. Take 2 minutes to learn more
In the previous analysis of the Tamadoge market, we observed that the market had found temporary support near the $0.00085 level. At that time, it appeared that the consolidation indicated a possible easing of selling pressure, potentially paving the way for a short-term recovery. However, recent price action has shown a breakdown below this level, with bulls now attempting to find support around the $0.0008 level. A potential bounce could occur from this point. There are indications of strong bullish activity just below the $0.0008 price level, suggesting increased buying interest in this area.
Key Levels
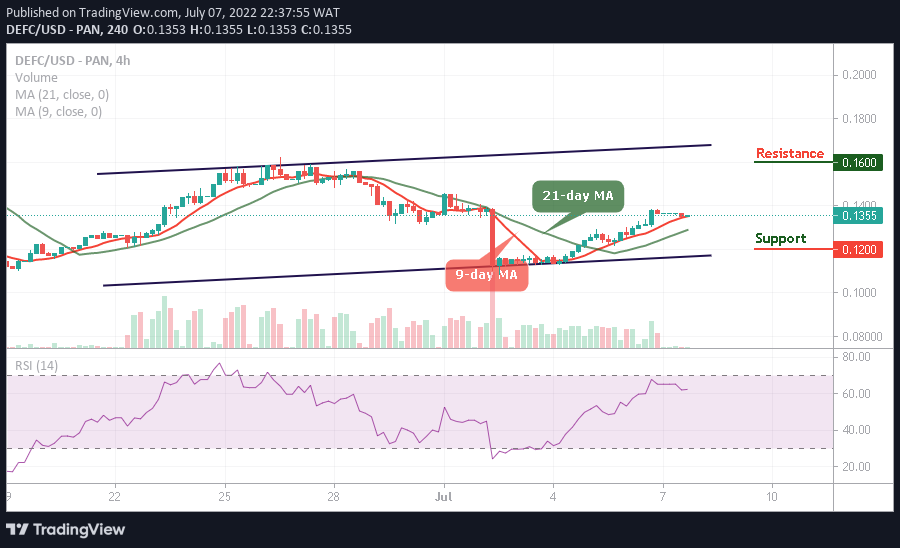
- Resistance: $0.013, $0.014, and $0.015
- Support: $0.0015, $0.00145 and $0.0014
TAMA/USD Price Analysis: The Indicators’ Point of View
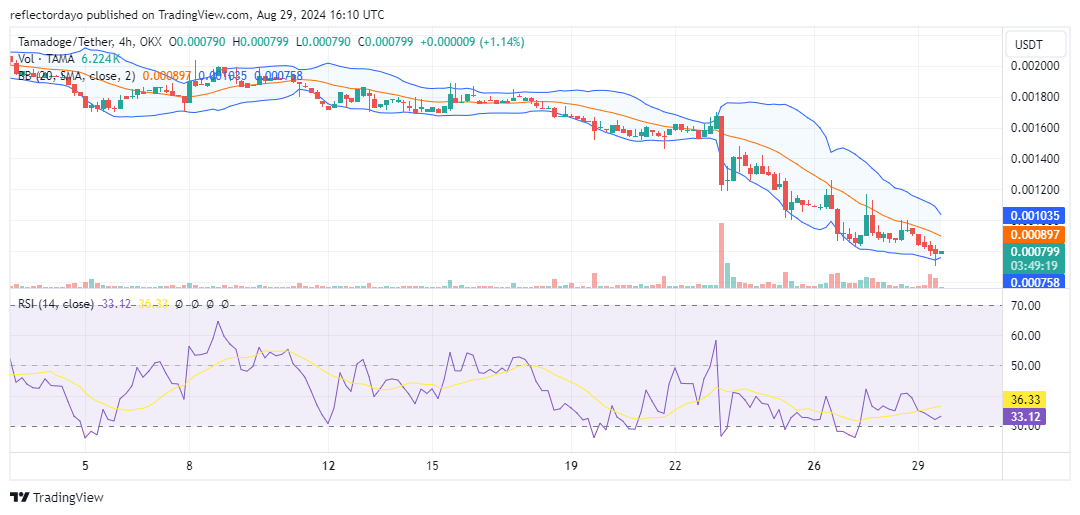
Following the recent market breakdown on August 23, the market has been characterized by descending peaks and lower lows. However, more recently (observable from August 27), the rate of these descending lows has slowed significantly, indicating that bulls are attempting to find support. The latest descending peak, formed around the $0.001 price level, has exerted pressure on the bulls’ position at the $0.00085 support level. This pressure has led the bulls to seek refuge near the $0.0008 threshold.
A key bullish crypto signal on the chart, suggesting the possibility of a rebound, is the appearance of a hammer candlestick pattern at the bottom of the trend. This indicates strong bullish sentiment below the $0.0008 price level, making an upward market bounce increasingly likely.
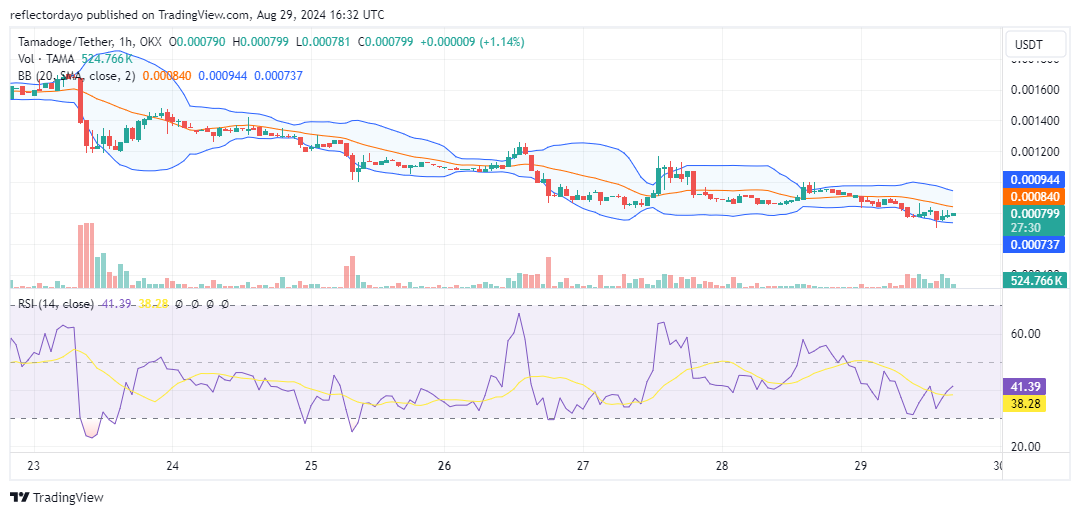
Tamadoge Short-Term Outlook: 1-Hour Chart
The 1-hour chart indicates that bearish momentum is slowing down as the market approaches the $0.0008 price threshold. From this perspective, the possibility of a bounce or price rally is becoming more feasible due to the reduction in bearish momentum. Additionally, it is important to observe how the price action is now consolidating around the $0.0008 level. At this point, demand and supply appear to be balanced, which suggests that a price rally could soon materialize.
Buy $TAMA!
This is #TamadogePursuit! ⬇️ 🏃♀️
1️⃣ Sign up with 20 free credits 🤑
2️⃣ Race, collect bones and doge obstacles ☠️
3️⃣ Earn a stack of $TAMA 💰📱Android: https://t.co/QD0kQsWGMz…
📱 iOS: https://t.co/y3p5LRkfOQ… pic.twitter.com/vqiKm4luzX— TAMADOGE (@Tamadogecoin) August 27, 2024