Tellor (TRB/USD) Sees Strong Rally as Bulls Aim to Hold Ground Near $45
Estimated Reading Time: 3 minutes
Don’t invest unless you’re prepared to lose all the money you invest. This is a high-risk investment and you are unlikely to be protected if something goes wrong. Take 2 minutes to learn more
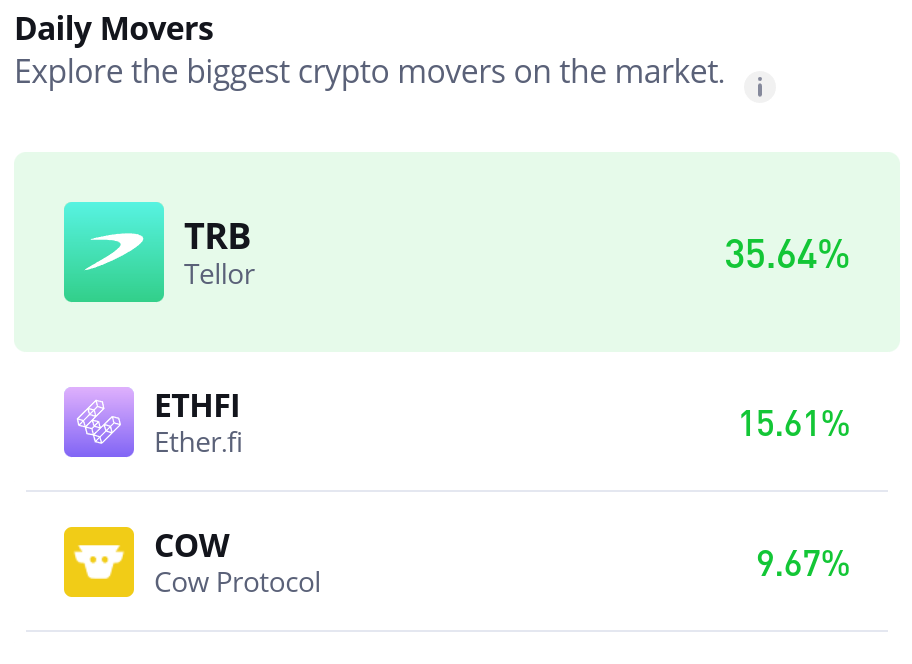
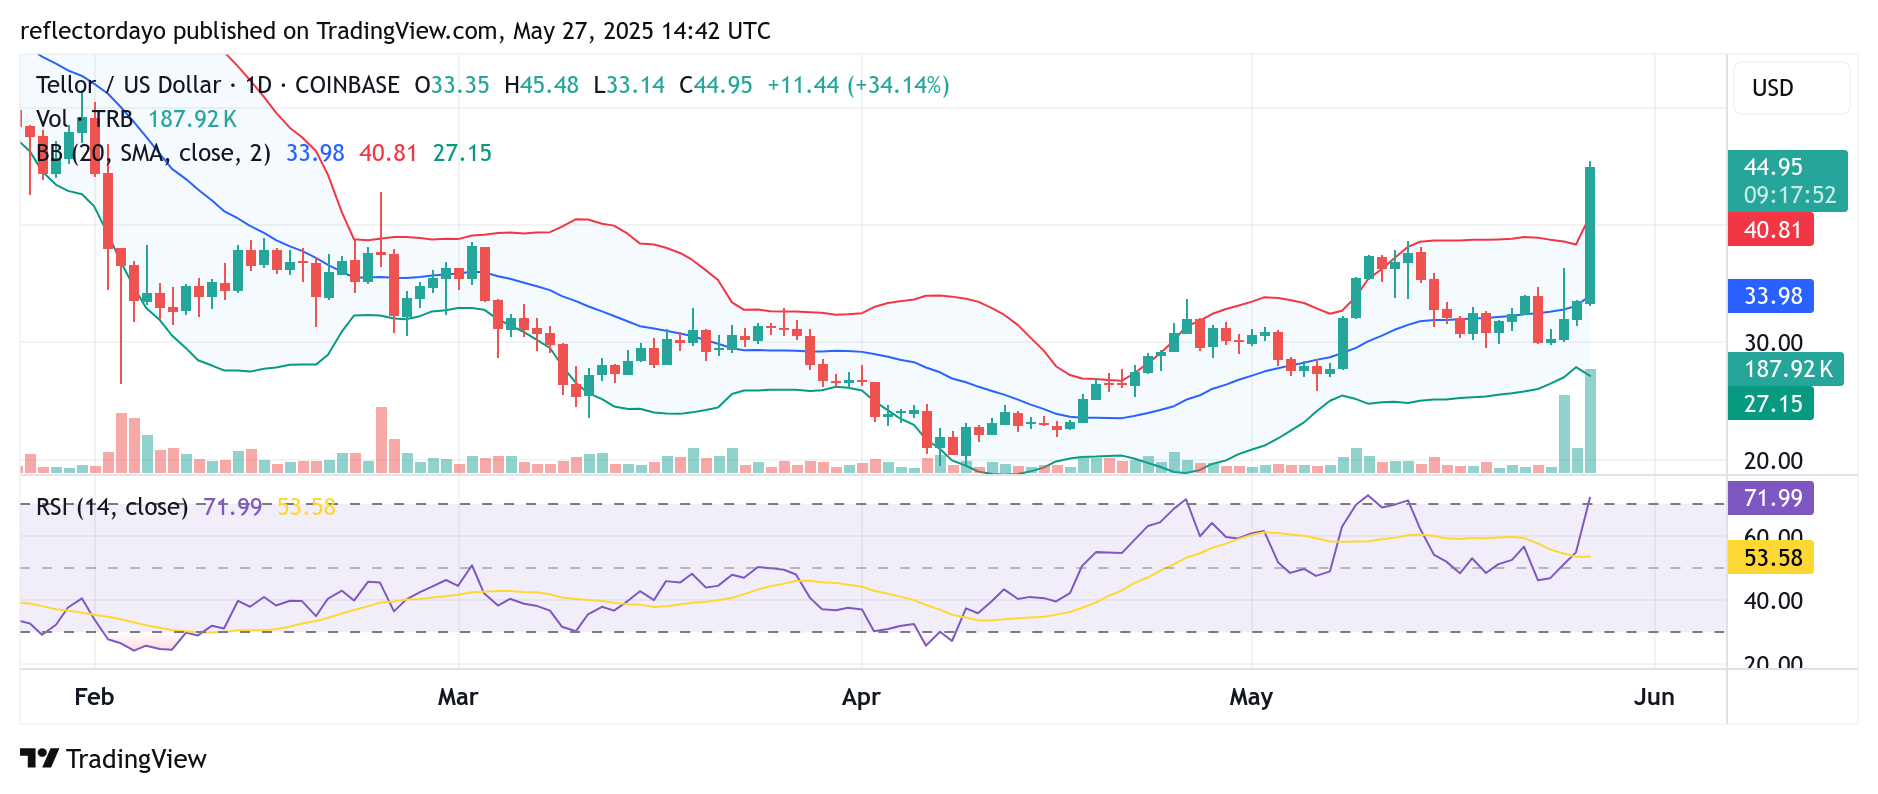
As of May 27, 2025, Tellor (TRB/USD) is trading around $44.49, reflecting a substantial intraday gain from its opening price of $33.00. This impressive surge showcases strong bullish momentum. However, recent trading sessions reveal a slight tapering in pace, suggesting growing caution among traders.
Despite the ongoing upward pressure, bullish participants are working to maintain their positions near the critical $45 mark. Yet, technical indicators are beginning to flash potential warning signs, hinting at an imminent price correction. Traders are advised to monitor market signals closely, as a short-term pullback may be on the horizon despite the prevailing optimistic sentiment.
Tellor Market Data
TRB/USD Price Now: $44.49
TRB/USD Market Cap: $119.6 million
TRB/USD Circulating Supply: 2.7 million TRB
TRB/USD Total Supply: 2.8 million TRB
TRB/USD CoinMarketCap Ranking: #335
Key Levels
- Resistance: $45.00, $50.00 and $55.00
- Support: $30.00, $25.00, and $20.00
Tellor (TRB/USD) Technical Outlook: Bullish Momentum Faces Overbought Warning
The current technical analysis of Tellor (TRB/USD) signals a strong bullish trend, with moving averages and other momentum indicators pointing toward continued upward movement. However, caution is warranted.
The Relative Strength Index (RSI) is currently reading 71.5, slightly above the overbought threshold of 70, indicating that the asset may be overextended in the short term. Market sentiment remains in the ‘Greed’ zone, with a score of 73—highlighting strong investor optimism that could sustain the current rally but also increasing the risk of a pullback.
While there is clear enthusiasm among buyers, the overbought signals suggest that entering the market at this point carries increased risk. A healthy retracement or the establishment of a stable support level would offer a more secure entry for new positions. Traders are advised to proceed with caution and watch for signs of a possible correction.
TRB/USD 4-Hour Chart: Minor Pullback Likely Before Uptrend Resumes
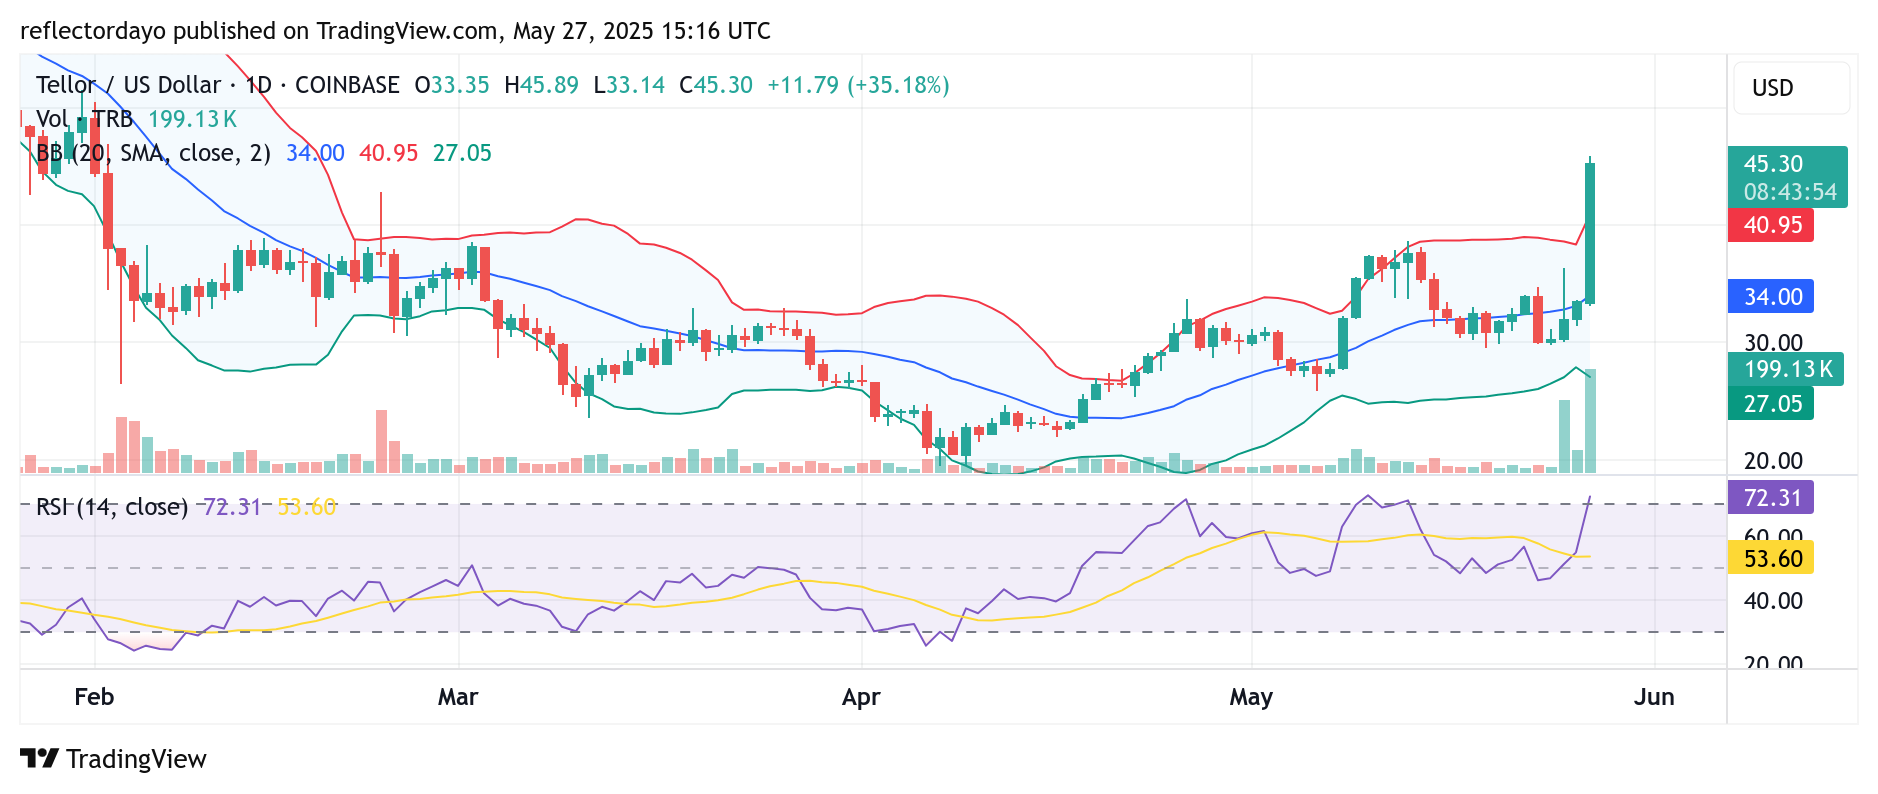
On the 4-hour chart, Tellor (TRB/USD) continues to mirror the bullish structure observed on the daily chart. Despite the ongoing buying pressure—likely driven by underlying market factors—analysts anticipate a potential short-term correction. TRB could dip slightly to around $38.94 before regaining upward momentum.
While a near-term pullback appears possible, the broader market outlook remains positive. Projections for the coming months suggest that, depending on investor sentiment and prevailing market conditions, TRB could rise to a target range between $47.80 and $69.46 by September 2025. Traders should remain cautious in the short term while preparing for possible continuation of the broader uptrend.