The Aave Market (AAVE/USD) Finds Solid Ground at $54.85
Estimated Reading Time: 3 minutes
Don’t invest unless you’re prepared to lose all the money you invest. This is a high-risk investment and you are unlikely to be protected if something goes wrong. Take 2 minutes to learn more
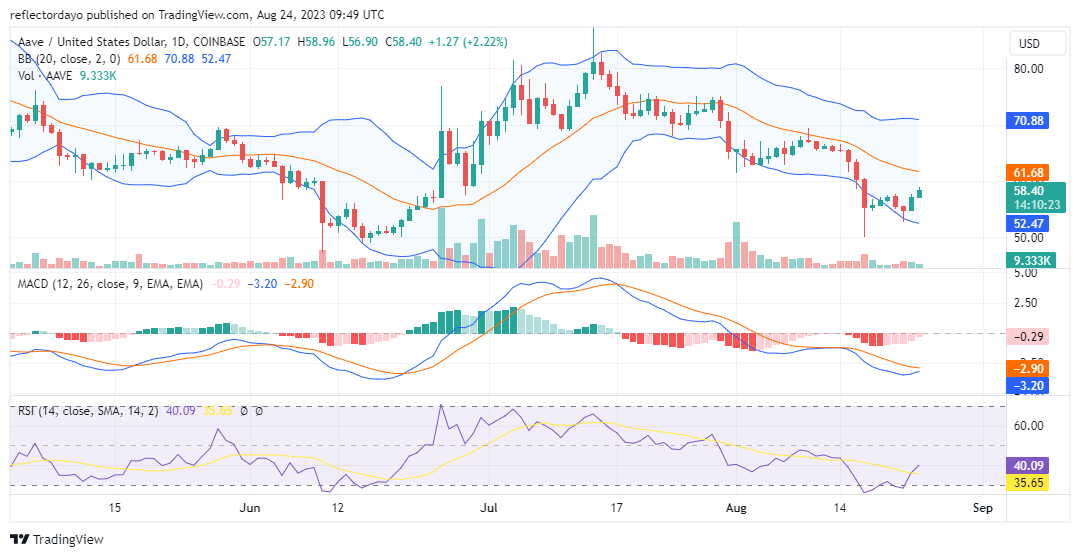
The Aave market is undergoing a recovery phase following a strong demand level being identified at the $54.84 price point. The bullish trend is currently tracking towards $61.7, coinciding with the current position of the 20-day moving average. This upward momentum was initiated when the bearish market gained sufficient traction to drive the price to a critical demand level of $50.
The $50 price level acted as a barrier for the bear market’s decline, an event that took place on August 17th. The trading session for that day commenced with sellers exerting control over the market. Subsequently, as the market reached the $50 mark, buyers initiated a recovery. By the close of the day, they had managed to regain approximately half of the territory previously lost to the bears.
The Aave Market Data
- AAVE/USD Price Now: $58.41
- AAVE/USD Market Cap: $856,431,131
- AAVE/USD Circulating Supply: 14,523,258 AAVE
- AAVE/USD Total Supply: 16,000,000
- AAVE/USD CoinMarketCap Ranking: #44
Key Levels
- Resistance: $60.00, $65.00, and $70.00
- Support: $52.00, $50.00, and $45.00.
Price Prediction for the Aave Market: The Indicators’ Point of View
Examining the AAVE market through the lens of the Bollinger Bands indicator reveals the market’s approach towards the 20-day moving average amidst its rally. Additionally, beneath the zero level of the Moving Average Convergence and Divergence (MACD), the MACD line is in the process of recovery and poised to intersect the signal line. This convergence will validate the shift in market dynamics.
Nevertheless, there’s a noteworthy concern regarding the volume traded between the previous day and today. Despite the market currently favoring a bullish trajectory, the histograms representing the trading volume are notably smaller in comparison to the candlestick’s size.
While the market’s dynamics might seem to have transitioned towards a bullish trend, prudent investors should exercise patience and await further confirmations. This includes the price actions effectively surpassing the 20-day moving average, the MACD line definitively crossing the signal line, and the Relative Strength Index (RSI) line departing from the bearish zone.
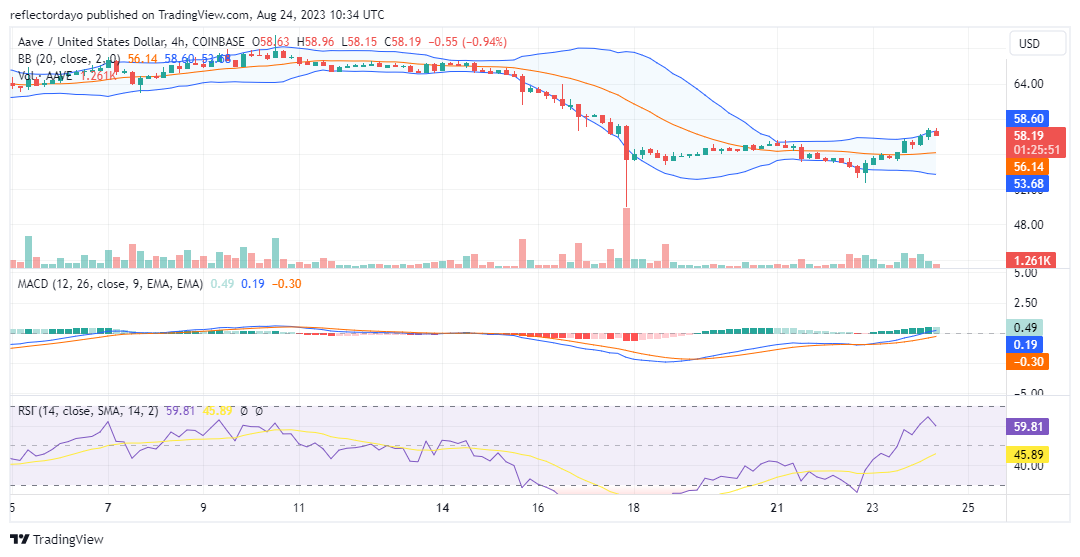
AAVE/USD 4-Hour Chart Outlook
The market’s characteristics diverge between the 4-hour timeframe and the daily chart. Specifically, the Bollinger Bands illustrate a confined price channel on the 4-hour chart, whereas the daily chart’s Bollinger Bands indicator depicts a broader price channel. This discrepancy suggests that the Bollinger Bands on the daily chart might imminently adapt to this recent shift. Consequently, this occurrence could potentially result in a gradual pace for the bullish recovery. Alternatively, there is the potential for the market to consolidate at its current levels.