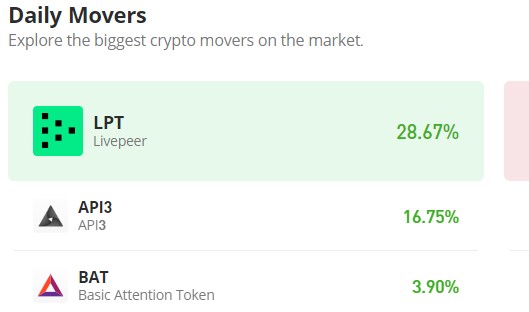
The API3 Market (API3USD) Breaks Out of the Narrow Range Market, Price on the Trail of $1.500
Estimated Reading Time: 2 minutes
Don’t invest unless you’re prepared to lose all the money you invest. This is a high-risk investment and you are unlikely to be protected if something goes wrong. Take 2 minutes to learn more
Since mid-June, the API3 market has been ensnared around the $1.00 price threshold. The impasse between supply and demand stems from a brief bear market that altered the market dynamics, leading the price to transition from $1.249 to $1.00.
The bull market began to alleviate this tense situation on August 7. After finding support at $0.867, the price surged vigorously, testing the $1.500 price mark. This shift in market dynamics enabled the bulls to establish a stronger support level at $1.056. Currently, the price is retracing back to $1.500, the peak it had attained on both August 6 and August 7.
The API3 Market Data
- API3/USD Price Now: $1.259
- API3/USD Market Cap: $105,297,220
- API3/USD Circulating Supply: 86,421,978 API3
- API3/USD Total Supply: 125,824,588
- API3/USD CoinMarketCap Ranking: #194
Key Levels
- Resistance: $1.500, $1.700, and $2.00.
- Support: $0.950, $0.900, and $0.850.
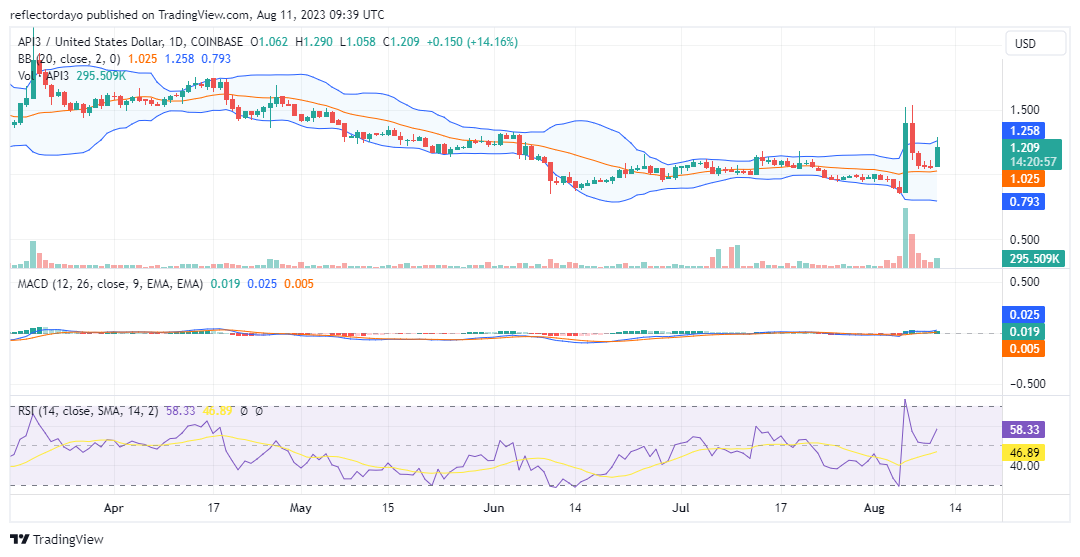
Price Prediction for The API3 Market: The Indicators’ Point of View
The Bollinger Bands indicator has not yet provided a clear depiction of the API3 market‘s direction. It appears that as the level of volatility escalated, it did so in both the bull and bear markets. Nevertheless, if the bulls manage to maintain their dominance in the market today and stage a retracement to $1.500, there’s potential for the market channel to shift towards an upward trajectory.
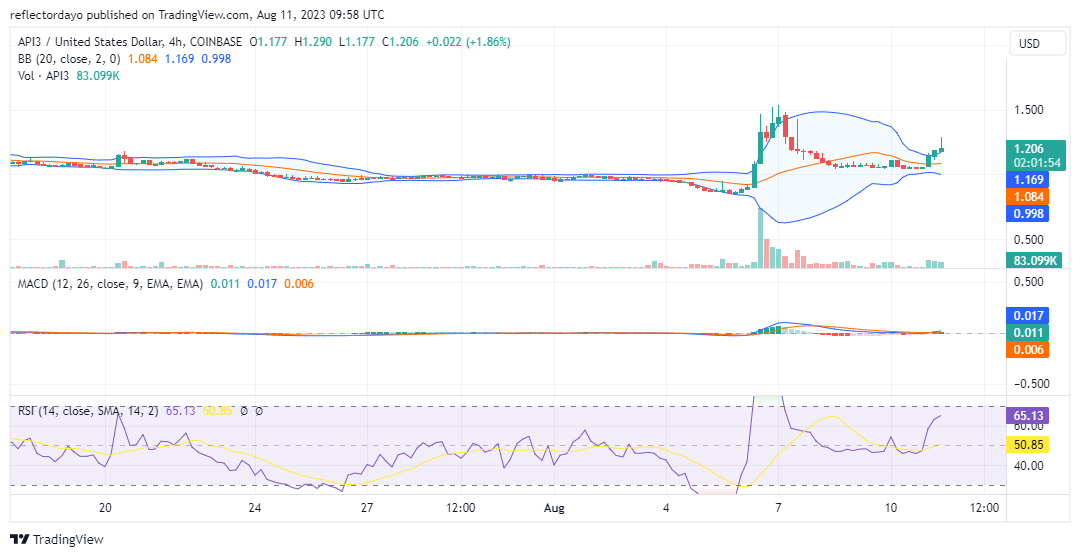
API3/USD 4-Hour Chart Outlook
Furthermore, taking this perspective into account, today’s bullish run is alleviating the constrained state of the market. The API3 market has undergone a brief period of consolidation since August 8. The ongoing bull market today appears to be inducing volatility even in the bear market, as evidenced by the Bollinger Bands displaying a divergence in their bands. Unfortunately, there is no clear indication of the price channel’s movement in a specific direction.