The Coti Market (COTI/USD) Bounces from Support, Eyes $0.152 Resistance
Estimated Reading Time: 3 minutes
Don’t invest unless you’re prepared to lose all the money you invest. This is a high-risk investment and you are unlikely to be protected if something goes wrong. Take 2 minutes to learn more
In today’s trading session, the Coti market has established a higher and pivotal support level, leading to a strong bullish trend. While the market may be eyeing the recent high at $0.152, we are beginning to see some bearish activity around the $0.14 price level, which appears to act as a resistance. However, despite this, the bullish momentum remains strong, with the target seemingly set at $0.152.
The Coti Market Data
- COTI/USD Price Now: $0.1372
- COTI/USD Market Cap: $217 million
- COTI/USD Circulating Supply: 1.6 billion
- COTI/USD Total Supply: 2 billion
- COTI/USD CoinMarketCap Ranking: #294
Key Levels
- Resistance: $0.14, $0.15, and $0.16
- Support: $0.12, $0.115, and $0.11.
The Coti Market Through the Lens of Indicators
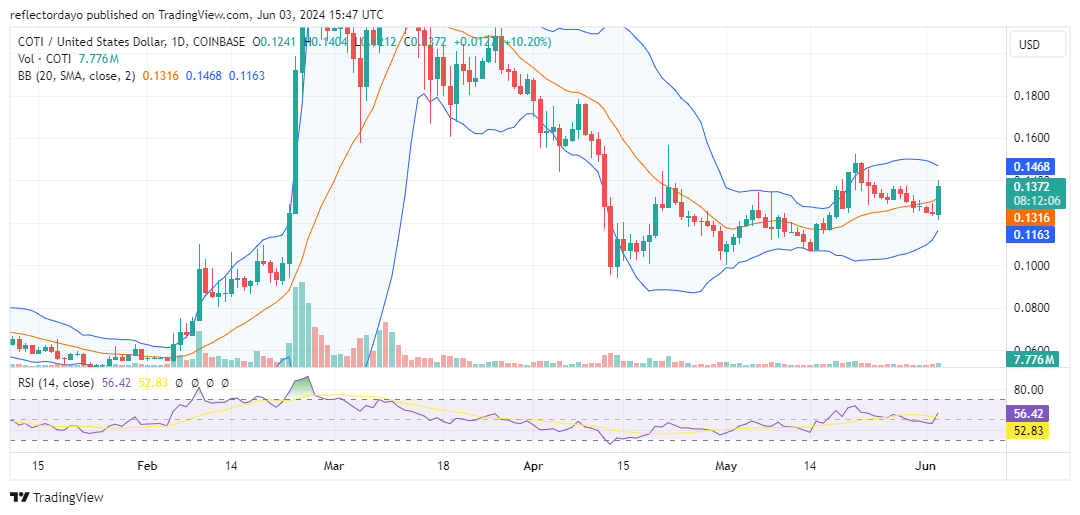
Between February and March, the Coti market gained significant upward traction, with the bullish run peaking at an impressive $0.28. Since then, the market has gradually changed direction, though remnants of bullish sentiment have remained. Toward the end of the first half of April, a significant bear market breakout caused the price to fall drastically to the $0.10 level, where bullish support re-emerged. Since then, the market has been experiencing higher lows, including another higher low observed in today’s session.
Breaking the $0.14 resistance level is crucial, as it may trigger a burst of bullish sentiment, potentially propelling the market toward its $0.152 target. The sharp price bounce has caused the RSI line to rise from below the 50 level into bullish territory. This crypto signal is able to further ignite bullish sentiment. However, considering the volume of trade, the histograms are quite small, indicating that the current price action may lack the strength to break through resistance due to low trading volume.
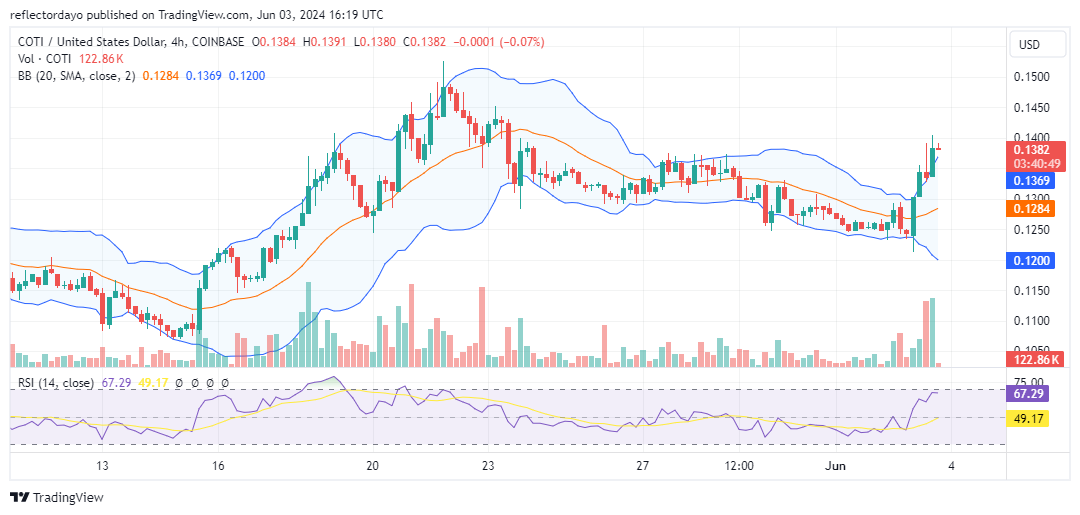
COTI/USD Price Prediction: 4-Hour Chart Analysis
Examining the market on the 4-hour chart, we observe the volume of trade indicator showing more substantial histograms, lending credence to the current bullish price movement. However, after the market reached the key $0.14 price level, demand and supply forces have become evenly matched, highlighting the ongoing tug-of-war at this level. Traders should patiently monitor the outcome of this dynamic. If the market breaks this immediate resistance, it will likely advance toward its main target.