The Graph (GRT/USD) Buying Increases Below the $0.1254 Price Level
Estimated Reading Time: 2 minutes
Don’t invest unless you’re prepared to lose all the money you invest. This is a high-risk investment and you are unlikely to be protected if something goes wrong. Take 2 minutes to learn more
The Graph market is on the rise but still needs to face resistance at the $0.1254 price level. GRT/USD buyers gave sellers a tough time as they were able to prevent a diving market. Bear market was triggered after the market reached the year high of $0.2308. However, a considerable amount of the buying pressure made the consolidating market oscillate around $0.1500. But towards the end of April, bears seem to be gaining the upper hand as they claim new lower resistance levels. Also, in today’s daily trading session, bullish recovery needs to deal with a much lower resistance level, which is $0.1254.
GRT/USD Price Statistics
- GRT/USD Price Now: $0.1225
- GRT/USD Market Cap: $1,100,879,579
- GRT/USD Circulating Supply: 8,986,666,744 GRT
- GRT/USD Total Supply: 10,658,400,440
- GRT/USD CoinMarketCap Ranking: #42
Key Levels
- Resistance: $0.14, $0.15, and $0.16
- Support: $0.12, $0.11, and $0.10.
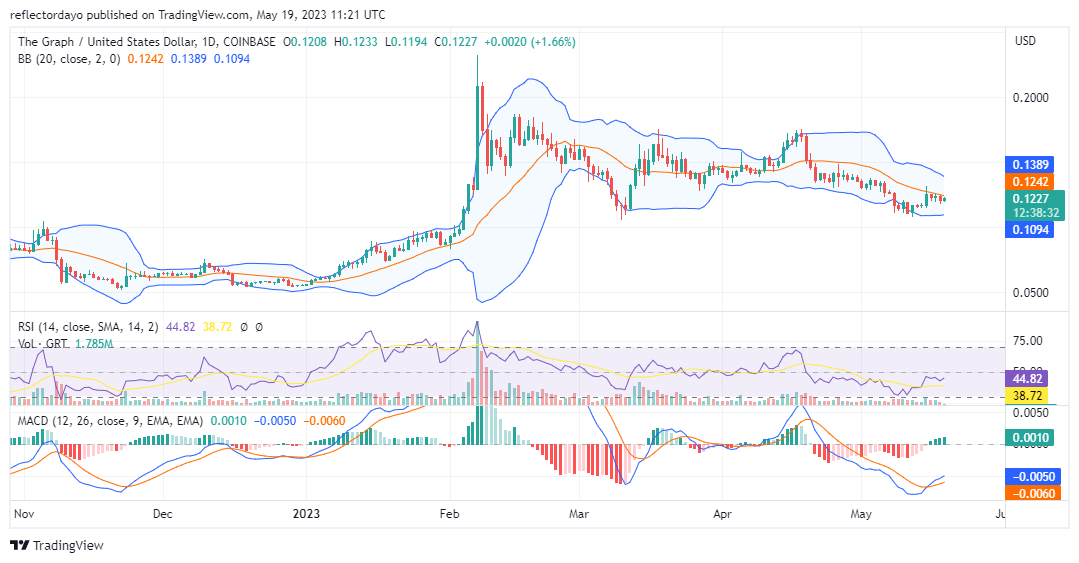
Price Prediction for The Graph: The Indicators’ Point of View:
In the Moving Average Convergence and Divergence (MACD), we already have a bullish crossover thanks to the significant bullish move on May 15. However, due to the key resistance level, the MACD line slows down even though it still retains bullish and progressive histograms. As for the Relative Strength Index (RSI), the momentum of the market has been measured continuously at level 45 since May 15.
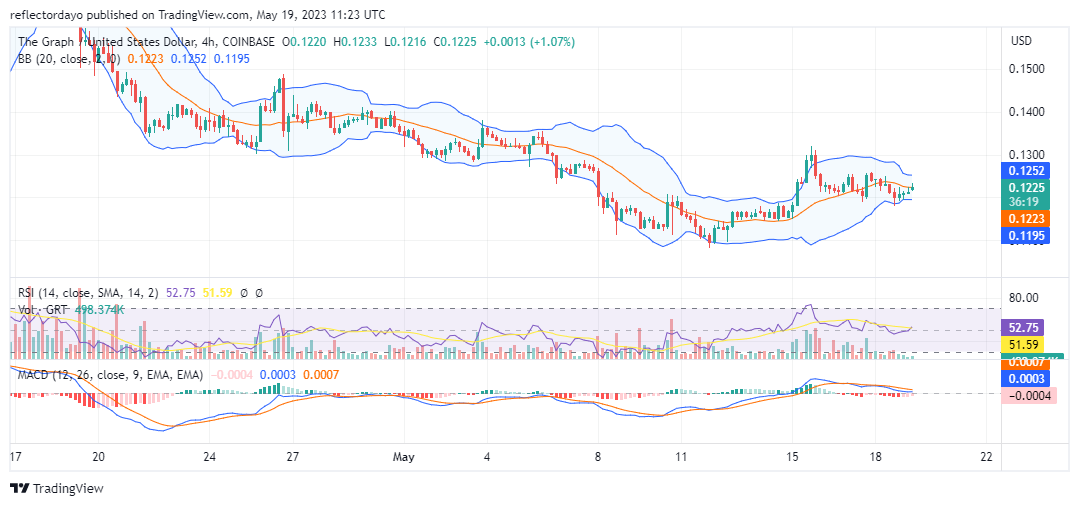
GRT/USD 4-Hour Chart Outlook:
Scaling down to a 4-hour timeframe, the price is at equilibrium, and according to the Bollinger Bands indicator, we are about to have a decisive directional breakout as the bands converge. Buyers seem to be gathering more momentum around the 20-day moving average to break out of the deadlock. The next bullish target might be $0.13.