The Graph (GRT/USD) Climbs Above $0.30; Can Bulls Hold On?
Estimated Reading Time: 3 minutes
Don’t invest unless you’re prepared to lose all the money you invest. This is a high-risk investment and you are unlikely to be protected if something goes wrong. Take 2 minutes to learn more
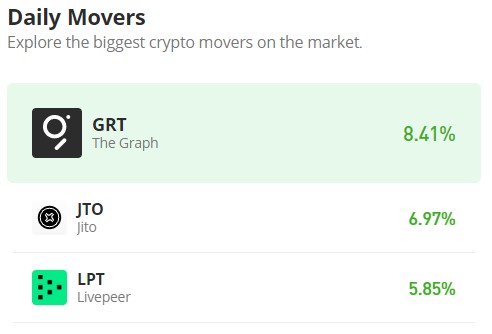
Presently, in The Graph market landscape, there is a notable increase in bullish momentum and heightened interest, contributing to upward volatility. This surge facilitates a market movement surpassing the $0.3 price threshold. Intriguingly, over the past week, this particular threshold has functioned as a resistance level, suggesting a potential stalling point. However, the recent resurgence in bullish momentum has effortlessly propelled the price beyond this resistance, underscoring its significance. Consequently, the current bull market necessitates the establishment of support above this level to sustain its momentum.
The Graph Market Data
- GRT/USD Price Now: $0.312
- GRT/USD Market Cap: $2.9 billion
- GRT/USD Circulating Supply: 9.5 billion
- GRT/USD Total Supply: 10 billion
- GRT/USD CoinMarketCap Ranking: #40
Key Levels
- Resistance: $0.33, $0.35, and $0.40
- Support: $0.25, $0.23, and $0.20.
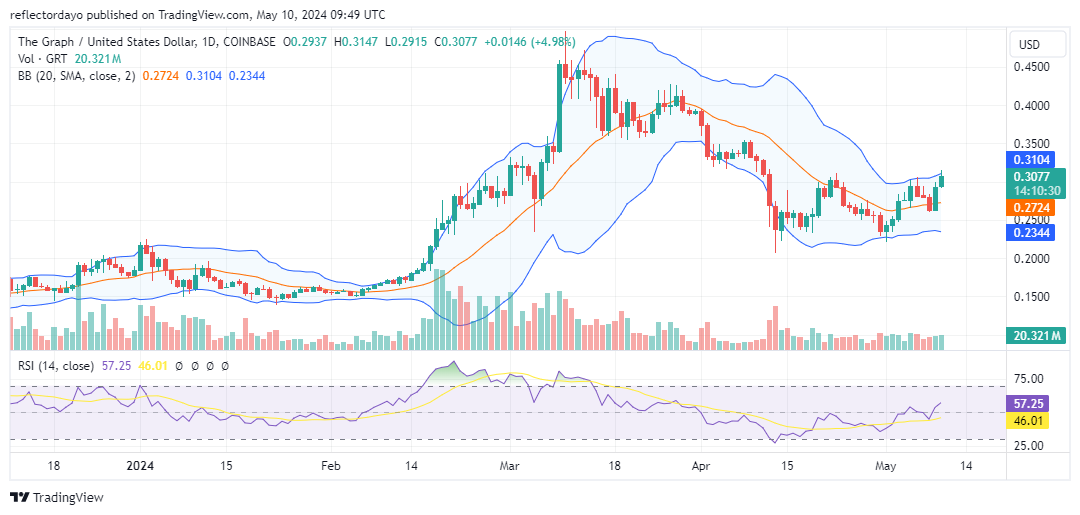
The Graph Through the Lens of Indicators
The current market trend indicates a notable shift towards bullish sentiment, as evidenced by various key indicators analyzed in this assessment. All signals point to a robust buy signal for cryptocurrencies. The escalating levels of bullish sentiment are reflected in both the upward trajectory of the two standard deviations of the Bollinger Bands indicator and the 20-day moving average. Additionally, confirmation of this bullish sentiment is apparent in the Relative Strength Index (RSI), which is demonstrating a strengthening upward momentum as indicated by the RSI line, currently registering at 57.
However, it’s imperative to acknowledge the presence of some minor bearish resistance as the market surpasses the critical $0.30 price level. Notably, recent crypto signals portraying bullish candlesticks from both today’s and yesterday’s sessions display upper shadows. This underscores the importance of establishing a support level at $0.30 promptly to mitigate potential downward pressure.
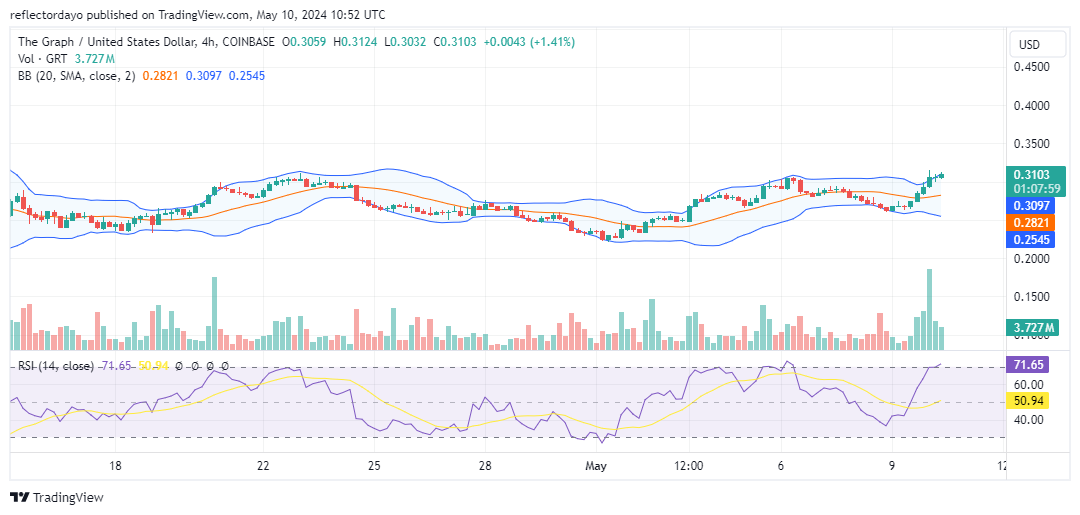
GRT/USD Price Prediction: 4-Hour Chart Analysis
Upon closer examination of The Graph market over a shorter timeframe, there are indications suggesting a potential onset of bullish exhaustion. This observation stems from the analysis of the initial 4-hour session, wherein a substantial trade volume histogram contrasts with the comparatively insubstantial candlestick. This divergence implies a clash between bullish and bearish sentiments, possibly signaling an impending price retracement.
Further reinforcing this assessment, the Relative Strength Index (RSI) reflects an overbought market condition. Consequently, the current bullish price action may undergo a corrective phase, with the $0.3 price level emerging as a prospective new support level.