The SIROC Indicator: How the Smoothed Indexed Rate of Change Can Predict Market Trends
Estimated Reading Time: 6 minutes
Don’t invest unless you’re prepared to lose all the money you invest. This is a high-risk investment and you are unlikely to be protected if something goes wrong. Take 2 minutes to learn more

In the world of technical analysis, traders and investors rely on various indicators to make informed decisions about market trends. One such valuable tool is the SIROC (Smoothed Index Rate of Change) indicator. Unlike the traditional Rate of Change (ROC) indicator, which can be volatile, the SIROC applies smoothing techniques to provide a more stable and reliable signal for market movements. In this article, we will explore the meaning, uses, and computation of the SIROC indicator to help traders better understand its application in financial markets.
What is the SIROC Indicator? The SIROC (Smoothed Index Rate of Change) indicator is a momentum-based technical tool designed to measure the rate at which a security’s price changes over a specific period while reducing short-term fluctuations. It is derived by applying a smoothing function, such as an Exponential Moving Average (EMA), to the traditional Rate of Change (ROC). This makes the SIROC particularly useful in filtering out market noise and identifying clearer trends in price movements.
Uses of the SIROC Indicator
- Trend Identification – SIROC helps traders recognize the strength and direction of a trend by analyzing price momentum over time.
- Signal Confirmation – It can be used alongside other technical indicators, such as Moving Averages or the Relative Strength Index (RSI), to confirm trading signals.
- Divergence Detection – SIROC can highlight divergences between price movements and momentum, signaling potential trend reversals.
- Entry and Exit Points – Traders use SIROC to time their market entries and exits based on positive or negative momentum shifts.
- Reducing Noise – Since it applies smoothing techniques, SIROC is particularly useful in volatile markets where short-term price fluctuations may lead to misleading signals.
Computation and Calculation of the SIROC Indicator
The SIROC is calculated in several steps:
- Calculate the Rate of Change (ROC): Where:
- Current Price is the most recent closing price.
- Price N Periods Ago is the closing price N periods ago.
- N is the chosen lookback period.
- Apply an Exponential Moving Average (EMA) to ROC: Where:
- EMA is the Exponential Moving Average applied to the ROC values.
- Smoothing Period determines how much the indicator is adjusted to remove volatility.
By applying the EMA to the ROC, the SIROC indicator smooths out short-term fluctuations and provides a more stable signal for traders to analyze.
Generating Signals With the SIROC indicator

1. Crossovers with the Zero Line
- Buy Signal: When the SIROC crosses above the zero line, it indicates increasing bullish momentum, suggesting a buying opportunity.
- Sell Signal: When the SIROC crosses below the zero line, it signals increasing bearish momentum, indicating a potential selling opportunity.
2. Trend Confirmation
- If the SIROC is above zero and rising, it confirms an ongoing uptrend and suggests staying in long positions.
- If the SIROC is below zero and falling, it confirms a downtrend, suggesting that short positions or exits from long positions may be appropriate.
3. Overbought and Oversold Conditions
- Some traders use predefined thresholds (e.g., SIROC above +10 or below -10) to determine overbought and oversold conditions.
- Overbought (Potential Sell Signal): If SIROC reaches an extreme high, it may indicate that the asset is overbought and due for a pullback.
- Oversold (Potential Buy Signal): If SIROC reaches an extreme low, it could suggest that the asset is oversold and due for a rebound.
4. Divergence Trading
- Bullish Divergence: If the price is making lower lows, but the SIROC is making higher lows, it suggests weakening bearish momentum and a potential reversal to the upside.
- Bearish Divergence: If the price is making higher highs, but the SIROC is making lower highs, it indicates weakening bullish momentum and a possible trend reversal downward.
Example of SIROC in Action
Important notice:
The SIROC indicator may not be a default indicator on TradingView however, one can manually create it using the combination of Exponential Moving Average (EMA) and Rate of Change (ROC)
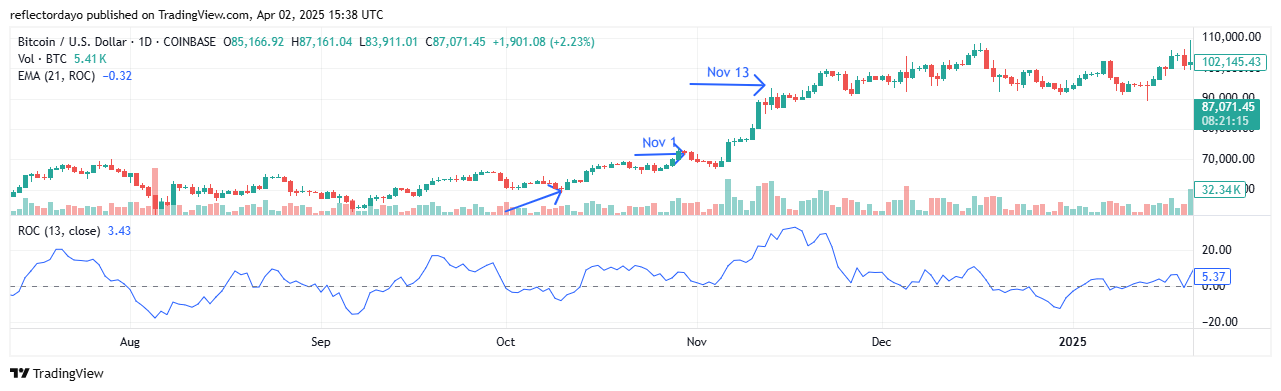
Let’s say you’re analyzing BTC/USDT with:
- N (Rate of Change period) = 13
- P (Smoothing period, EMA) = 21
If Bitcoin’s 21-EMA changes from $70,000 to $90,000 over 13 periods, the SIROC formula would be:
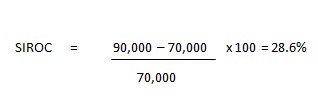
The rate of change in the market, based on calculations, stands at 28.6%. The market crossed the zero level on October 13, triggering a surge in momentum as prices climbed rapidly. However, the SIROC quickly signaled an overbought condition after rising beyond the +10 level, leading to a slight correction.
Despite this pullback, price action remained above the zero level, indicating that bullish momentum was still intact. This ultimately fueled a stronger rally, propelling the market to a peak of $90,000 on November 13. As the market became heavily overbought, a significant correction followed.
Nevertheless, with the SIROC still holding above zero, prices made a few upward moves before transitioning into a consolidation phase. During this period, the indicator line oscillated around zero, reflecting market indecision.
Conclusion
The Smoothed Relative Strength Index Oscillator (SIROC) is a powerful tool for traders seeking a more refined approach to trend analysis and momentum trading. By combining the strengths of the traditional RSI with an added smoothing mechanism, SIROC helps filter out market noise and provides clearer signals for identifying potential reversals and trend continuations.
When used alongside other technical indicators and sound risk management strategies, SIROC can enhance decision-making and improve the timing of trade entries and exits. However, like any trading tool, it is most effective when integrated into a well-rounded trading strategy rather than relied upon in isolation.
By understanding how SIROC works and applying it in the right market conditions, traders can gain an edge in navigating volatile price movements and capitalizing on high-probability trading opportunities.