Top Trending Coins for Today, February 2: DCOIN, XRP, RUNE, TRUMP and SOL
Estimated Reading Time: 6 minutes
Don’t invest unless you’re prepared to lose all the money you invest. This is a high-risk investment and you are unlikely to be protected if something goes wrong. Take 2 minutes to learn more
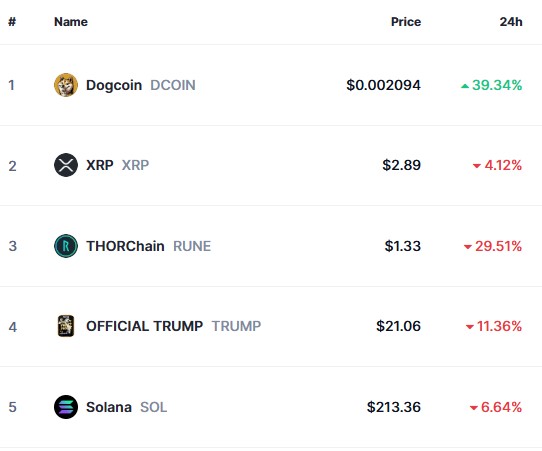
The list of trending coins for this week shows a largely consolidating performance across the market, from the first to the fifth position. Even the XRP market, which holds the second position on the chart, is experiencing significant bearish sentiment at a key resistance level around $3.00 which has caused price movement to stagnate at this level.
Apart from Dogcoin (DCOIN), which has managed to maintain its position, other markets have undergone significant corrections in the past 24 hours. For a deeper analysis of each market, let’s examine them one by one.
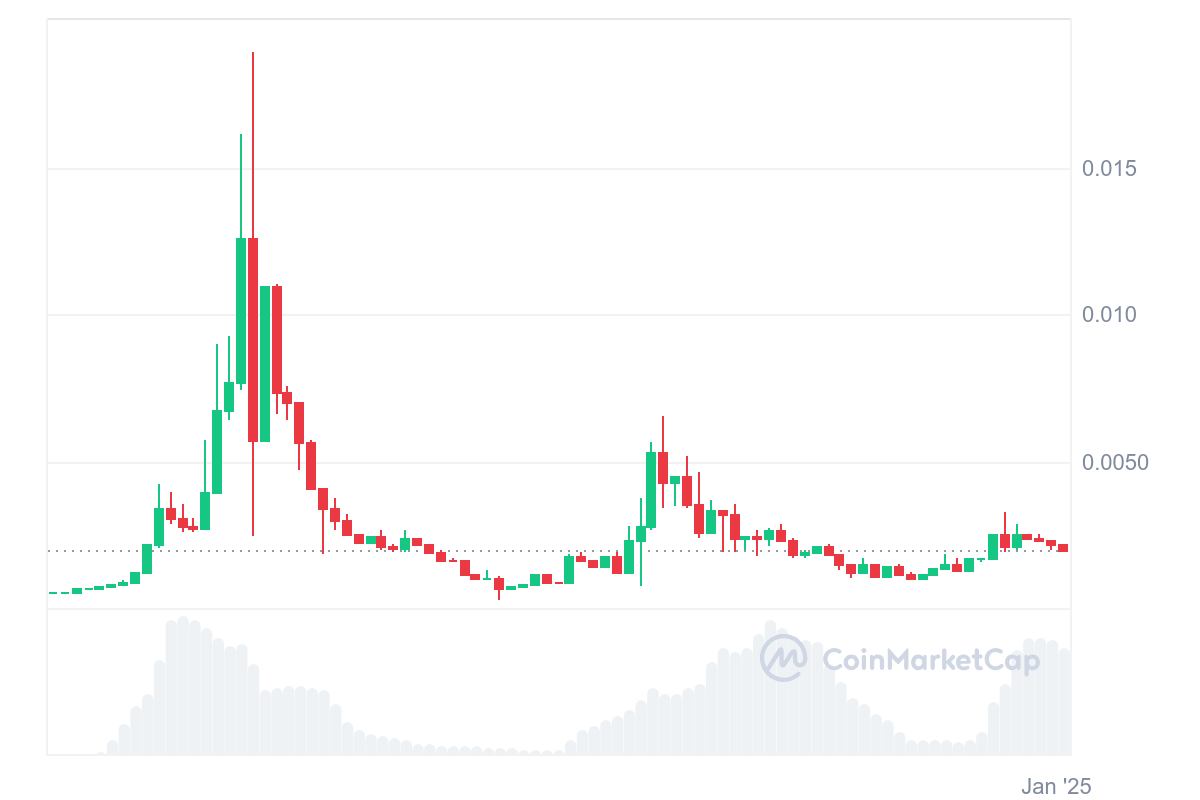
Dogcoin (DCOIN)
Major Bias: Indecision
The Dogcoin (DCOIN) market holds the first position on this week’s trending list. However, according to CoinMarketCap rankings, it is significantly lower, currently positioned at 3,093. Despite this, it has secured the top spot on the trending table due to key considerations that may not necessarily be linked to strong bullish price action.
One possible reason for this ranking is the market’s price stability around the $0.002 level over an extended trading period. Additionally, fundamental factors—such as increased attention or demand over the past seven days or the last 24 hours—may have contributed to its rise to the top position.
Current Price: $0.00197
Market Capitalization: $1.97 million
Trading Volume: $1 billion
XRP (XRP)
Major Bias: Indecision
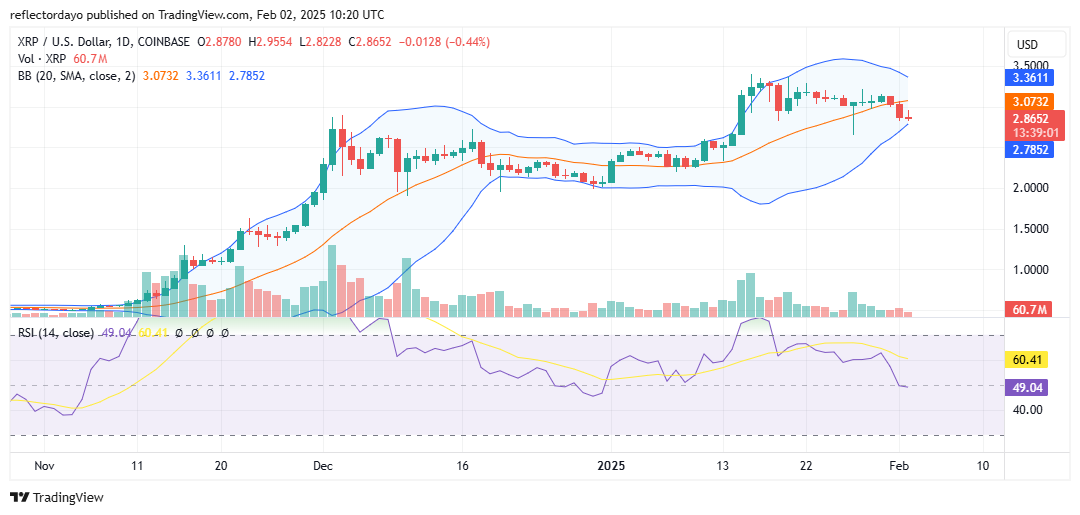
The XRP market holds the second position on the trending list. Over the past few weeks, it has gained significant attention in the broader crypto market. Its price has gradually risen from below the $1.00 threshold, reaching as high as $3.00.
After the market climbed to $2.50, bearish sentiment emerged, leading to a period of consolidation as traders became uncertain about the continuation of the upward trend. However, the price broke out once more, peaking at $3.40 on January 17. The subsequent correction led to consolidation around the $3.00 level, establishing it as a key support zone.
Yesterday, bearish pressure pushed the price below the $3.00 mark. Despite this breakdown, selling momentum appears to be weakening. The emergence of a doji candlestick in the current trading session, following the recent bearish trend, suggests a potential upward rebound.
Current Price: $2.87
Market Capitalization: $166 billion
Trading Volume: $6.4 billion
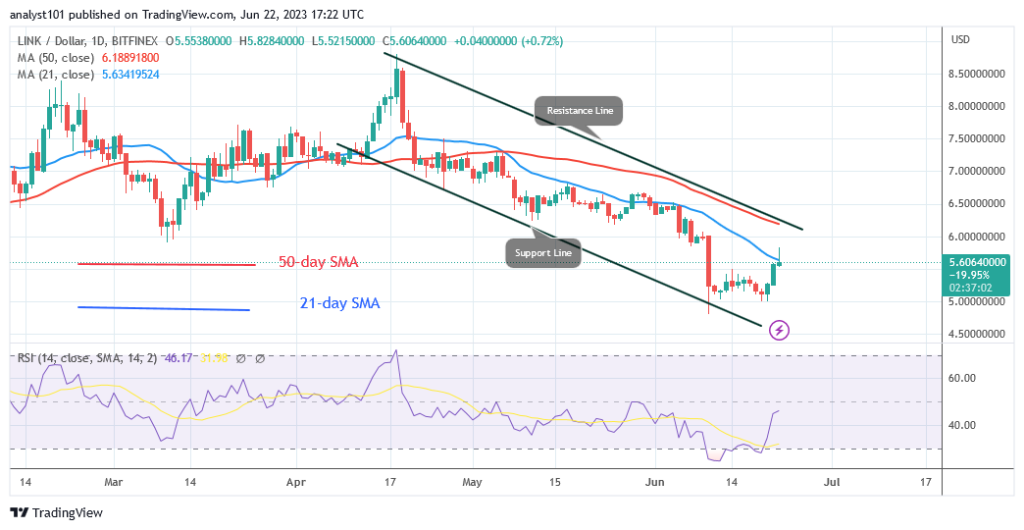
THORChain (RUNE)
Major Bias: Bearish
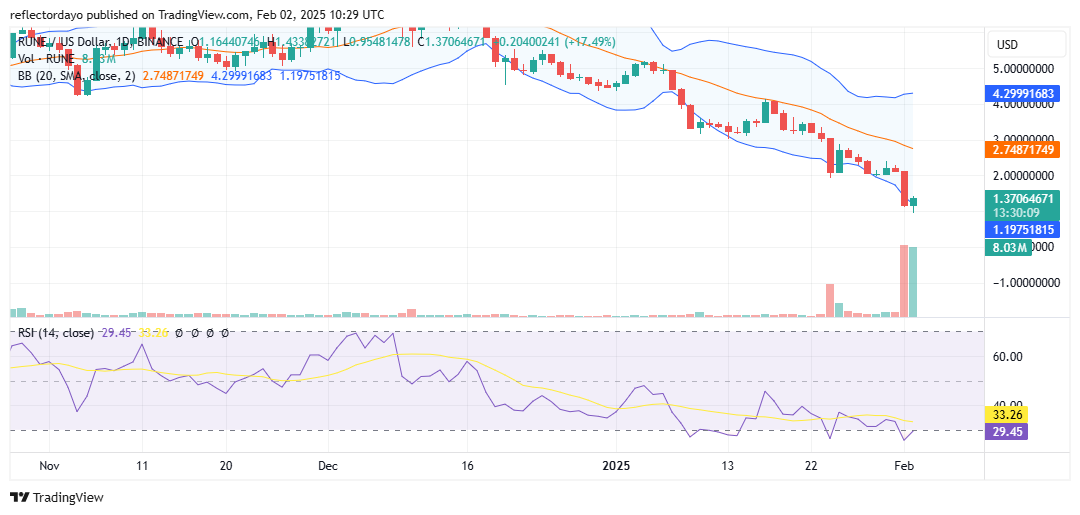
This market has shown a strong bearish bias, consistently trending downward. It crossed below the 20-day moving average in late December and has remained below this level ever since.
Although there are signs of potential bullish movement, recent trading volume data suggests a notable increase in trader interest. Significant trade histograms observed yesterday and today indicate heightened market activity. While this has not yet resulted in a full reversal to the upside, it could be an early signal of a potential recovery, as today’s candlestick is green, albeit modest in size.
The tall histogram accompanying today’s candlestick suggests that bullish recovery efforts are facing resistance from lingering bearish pressure. However, according to the Relative Strength Index (RSI), which is currently hovering around the 30 level, the market is nearing oversold conditions. This could prompt traders and analysts to take bullish positions, potentially leading to a price rebound.
Additionally, with the market testing the critical $1.00 price level, some traders may be looking to buy at this point. The approach of this major support level appears to be generating increased market interest and activity.
Current Price: $1.34
Market Capitalization: $479 million
Trading Volume: $1.4 billion
OFFICIAL TRUMP (TRUMP)
Major Bias: Bearish
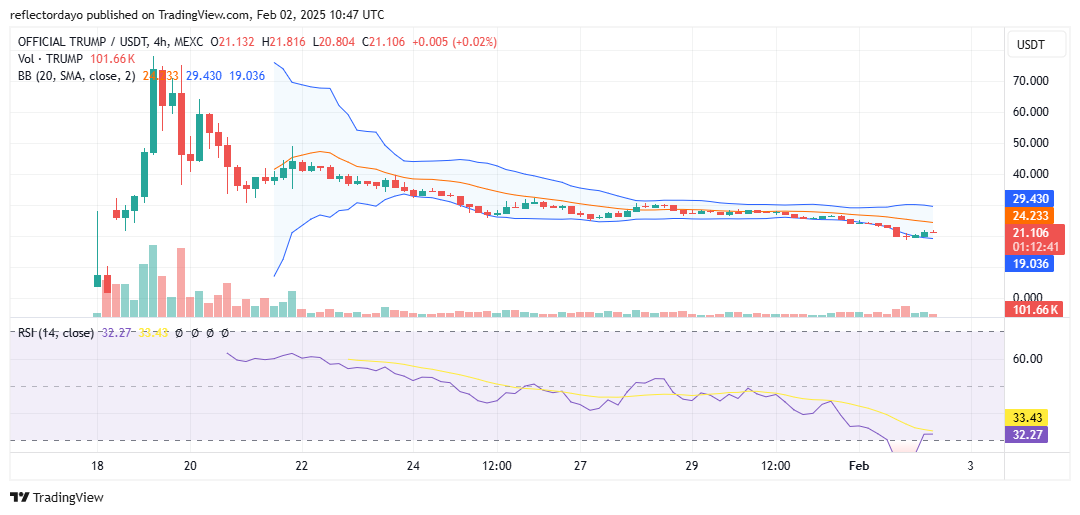
For some time now, the OFFICIAL TRUMP market has been undergoing a correction after peaking at the $80 price level. The bearish trend initially drove the price down to $40, followed by a gradual decline toward $30. The subsequent downward movement in the crypto signal has been met with intermittent bullish sentiment, slowing the bearish momentum as the price now approaches the critical support level of $20.
Additionally, the Relative Strength Index (RSI) indicates that the market is currently in strongly oversold territory. Under normal conditions, this signal would suggest a potential rebound and upward price movement. However, given its memecoin nature, the price could experience sudden surges at any moment, driven by hype and fundamental developments.
Current Price: $21
Market Capitalization: $4 billion
Trading Volume: $73.5 billion
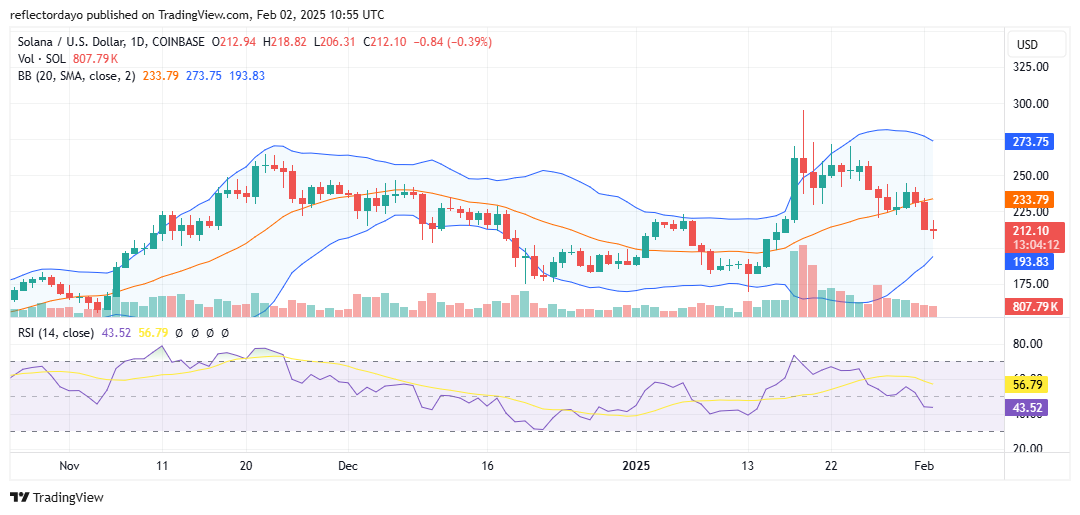
Solana (SOL)
Major Bias: Bearish
Following Solana’s peak near the $300 price level, a bearish correction has been unfolding. In the current trading session, price action remains below the moving average. However, as the price approaches the $200 level, it appears to be attracting investor interest. This is evidenced by the formation of a plus-sign doji in today’s daily session, which, following a strong bearish candlestick, suggests a potential price rebound.
If an upward rally occurs, the price may find higher support around the $250 level—provided the rally successfully breaks resistance at that point. A breakout above this resistance would likely establish it as a new support level, reinforcing bullish momentum.
Current Price: $0.37
Market Capitalization: $396 million
Trading Volume: $1.2 billion