UMA Token (UMA/USD) Gears Up for Continued Bullish Momentum in Price Rally
Estimated Reading Time: 2 minutes
Don’t invest unless you’re prepared to lose all the money you invest. This is a high-risk investment and you are unlikely to be protected if something goes wrong. Take 2 minutes to learn more
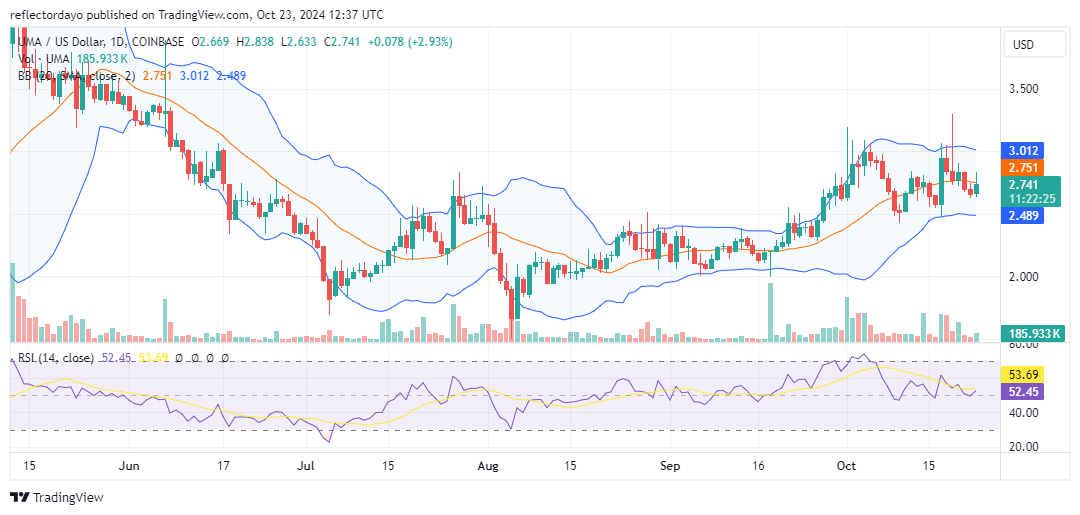
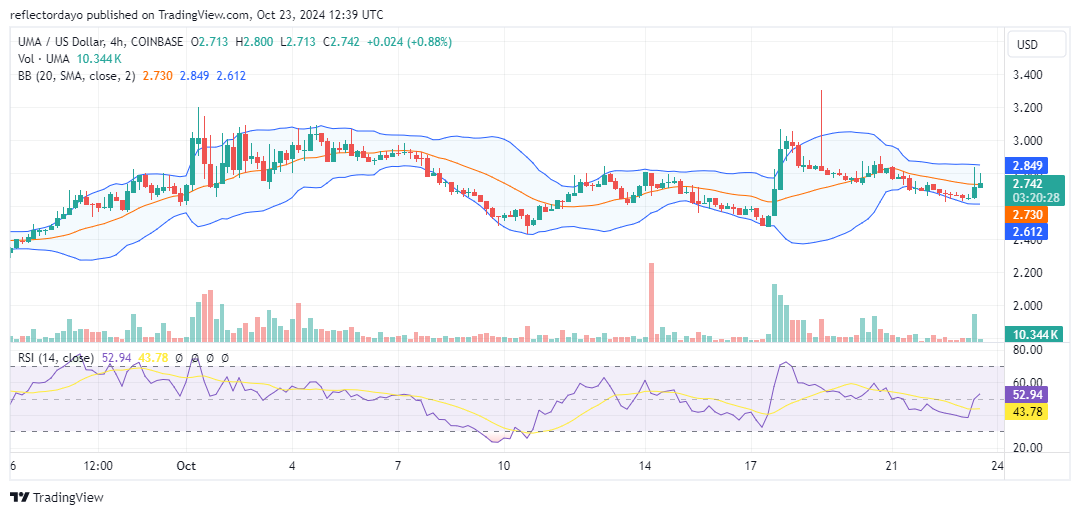
After spending some time attempting to overcome the $2.50 resistance level, the UMA Token(UMA) market successfully broke above it in late September. Following a brief encounter with resistance at the $3.00 level, $2.50 has since transitioned into a support zone. On October 19, a bullish push attempted another breakout, but resistance at $3.00 caused the market to retreat back towards $2.50. However, this time, the crypto signal established a minor upper support level, indicating that bullish momentum is building, and the bulls are poised to challenge the $3.00 resistance once again.
The UMA Token Market Data
- UMA/USD Price Now: $2.74
- UMA/USD Market Cap: $236 million
- UMA/USD Circulating Supply: 85 million
- UMA/USD Total Supply: 121 million
- UMA/USD CoinMarketCap Ranking: #194
Key Levels
- Resistance: $3.00, $3.50 and, $4.00
- Support: $2.50, $2.00, and $1.50.
The UMA Token Market Through the Lens of Indicators
The upper shadows on recent candlesticks suggest a notable presence of bearish traders at this price level. However, the UMA token bulls remain optimistic, steadily gaining momentum as they inch closer to testing the upper levels. This gradual buildup could eventually weaken the $3.00 resistance until it breaks. Despite this bullish sentiment, there is a noticeable divergence between the price action and the volume indicator’s histograms. While the price is making marginal upward movements, the volume histogram is in decline. Although the price is unlikely to fall below the $2.50 support level, supply and demand may converge, leading to a consolidation phase above this price point.
UMA/USD Price Prediction: 4-Hour Chart Analysis
From the perspective of the 4-hour chart, the market is showing a gradual decline in price action toward the key support level at $2.50. Despite this downward movement, the bulls remain cautiously optimistic, though it appears the bears are gaining control in this timeframe. The bulls are currently attempting to defend the $2.65 level. However, if this level breaks, the market may test the key support at $2.50, where a potential bounce could occur.