Uniswap (UNI/USD) Breaks Key Resistance, Aims for Stability Above $9.00
Estimated Reading Time: 3 minutes
Don’t invest unless you’re prepared to lose all the money you invest. This is a high-risk investment and you are unlikely to be protected if something goes wrong. Take 2 minutes to learn more
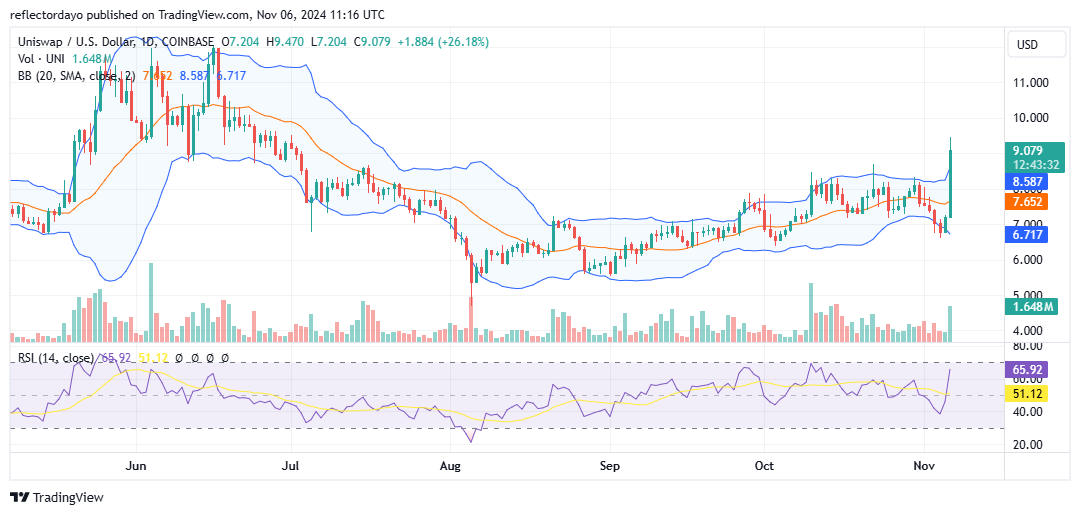
The Uniswap market has finally broken decisively above the $8.00 resistance level. Demand and supply have been at a standstill around this crucial level for some time. This resistance level, established on October 10, has held steady, while bullish support around $7.00 has kept the market within a horizontal trading channel. Recently, bullish momentum built up just below this key support level, triggering a strong upward move that began yesterday and has impressively continued into today, with price action now surging above the critical $9.00 level.
Uniswap Market Data
- UNI/USD Price Now: $9.174
- UNI/USD Market Cap: $5.5 billion
- UNI/USD Circulating Supply: 600 million UNI
- UNI/USD Total Supply: 1 billion UNI
- UNI/USD CoinMarketCap Ranking: #19
Key Levels
- Resistance: $9.50, $10.00, and $10.50
- Support: $8.50, $8.00, and $7.50.
Uniswap Through the Lens of Indicators
The Relative Strength Index (RSI) reflects a sharp upward price movement, with the RSI line rising almost vertically. Such a rapid bullish rally may prompt a substantial correction, which has indeed begun as the price action recently peaked near the $9.50 level. Uniswap traders should closely monitor the $9.00 level. If the market bounces and continues upward from this point, it could either consolidate above $9.00 or aim for the next target at $10.00. However, given the recent surge in volatility of the crypto signal, a drop below $9.00 could lead to a deeper decline, though the previous resistance level of $8.00 may now serve as a support level.
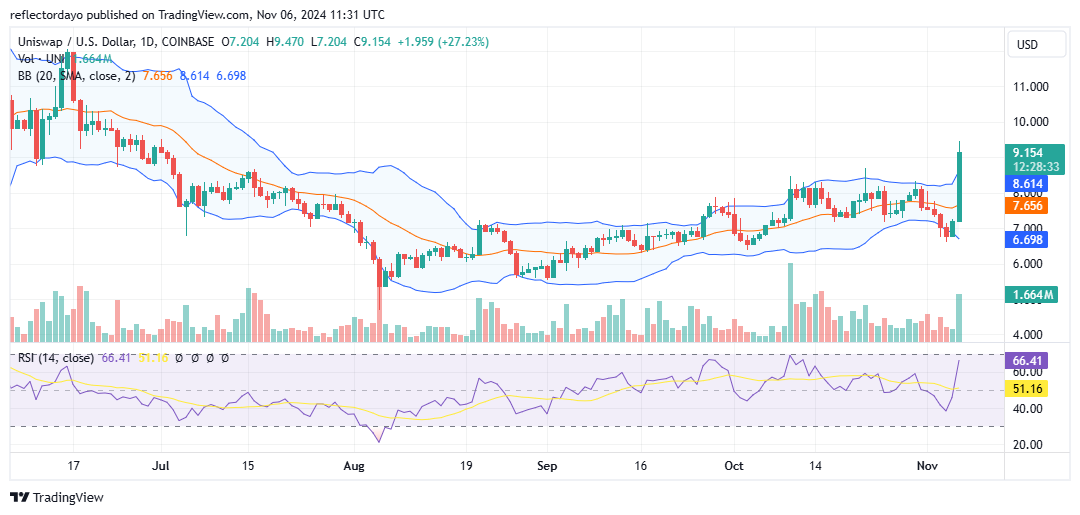
UNI/USD Price Prediction: 4-Hour Chart Analysis
Traders should exercise caution and closely monitor price action, especially given the divergence in the Bollinger Bands indicator. While strong trade volume histograms support the ongoing bullish trend, the heightened volatility suggests that any correction could be significant. The Relative Strength Index (RSI) on the 4-hour chart is currently indicating a highly overbought condition, with momentum measured at 83. Traders should focus on the $9.00 level; if the market dips below this threshold, the ensuing bearish movement could target the $8.00 level as the next support.