ZKsync (ZK/USD) Price Action Update: Bullish Momentum Faces Temporary Pause
Estimated Reading Time: 3 minutes
Don’t invest unless you’re prepared to lose all the money you invest. This is a high-risk investment and you are unlikely to be protected if something goes wrong. Take 2 minutes to learn more
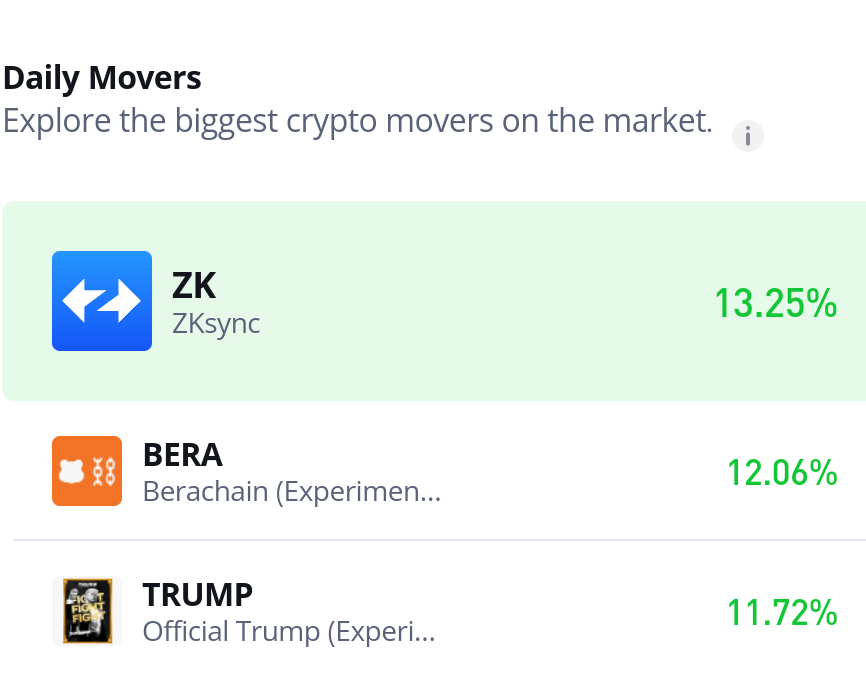
ZKsync (ZK/USD) began a notable bullish run in the previous trading session, with price action initiating a rebound from the $0.05 support zone. The upward momentum extended into today’s session, pushing the price as high as $0.074. However, a brief correction followed, likely triggered by profit-taking activity at this level.
Despite the pullback, overall market sentiment remains bullish. For the current upward movement to gain stronger validation, the price must break through two critical resistance thresholds: $0.075 and subsequently $0.08.
ZKsync Market Data
- ZK/USD Price Now: $0.071
- ZK/USD Market Cap: $262 million
- ZK/USD Circulating Supply: 21 billion ZK
- ZK/USD Total Supply: 3.7 billion ZK
- ZK/USD CoinMarketCap Ranking: #147
Key Levels
- Resistance: $0.075, $0.080 and $0.085
- Support: $0.065, $0.060, and $0.055
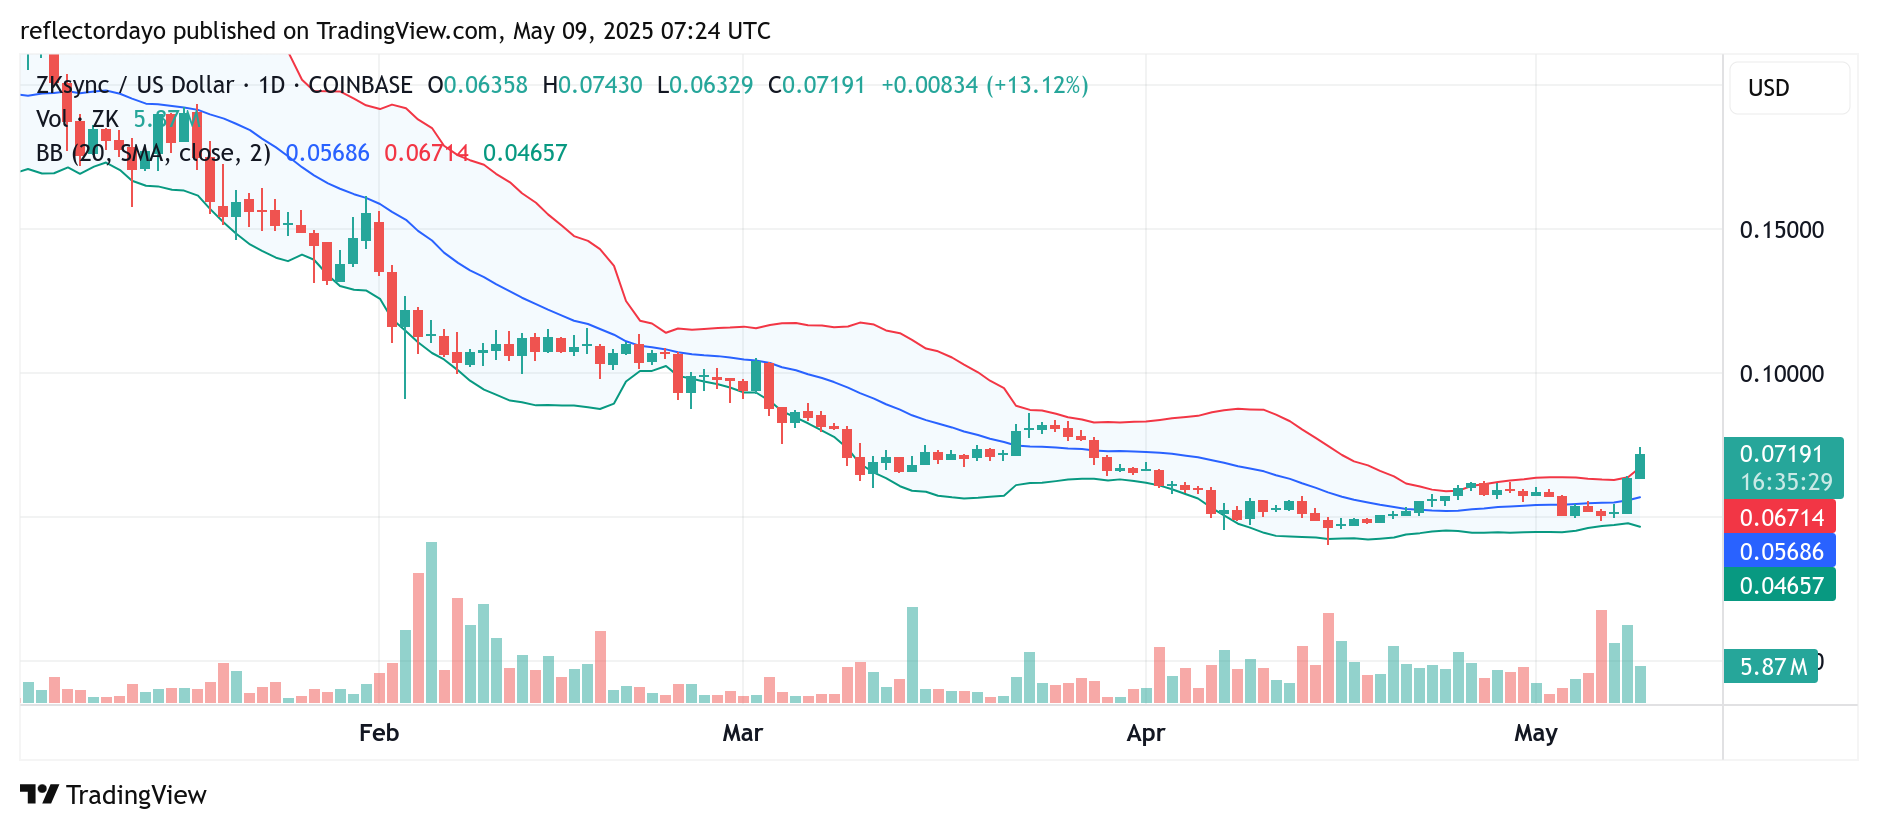
ZKsync (ZK/USD) Daily Chart Outlook: Volume Surge Preceded Bullish Breakout
Before the recent price surge in the ZKsync (ZK/USD) market, trading volume had already indicated growing momentum. Between May 5 and May 7, price action consolidated tightly around the $0.05 level. During this period, the volume histogram began to show a notable increase, signaling heightened activity and growing interest from market participants.
Initially, buying and selling pressure appeared evenly matched. However, a breakout soon followed, propelling the market toward the $0.075 resistance level. Following this surge, a minor pullback has emerged, likely due to profit-taking and increased caution among traders.
The current candlestick’s declining volume histogram suggests a slowdown in momentum. If the correction deepens, the $0.07 level could act as a new higher support zone, offering a potential platform for bullish continuation.
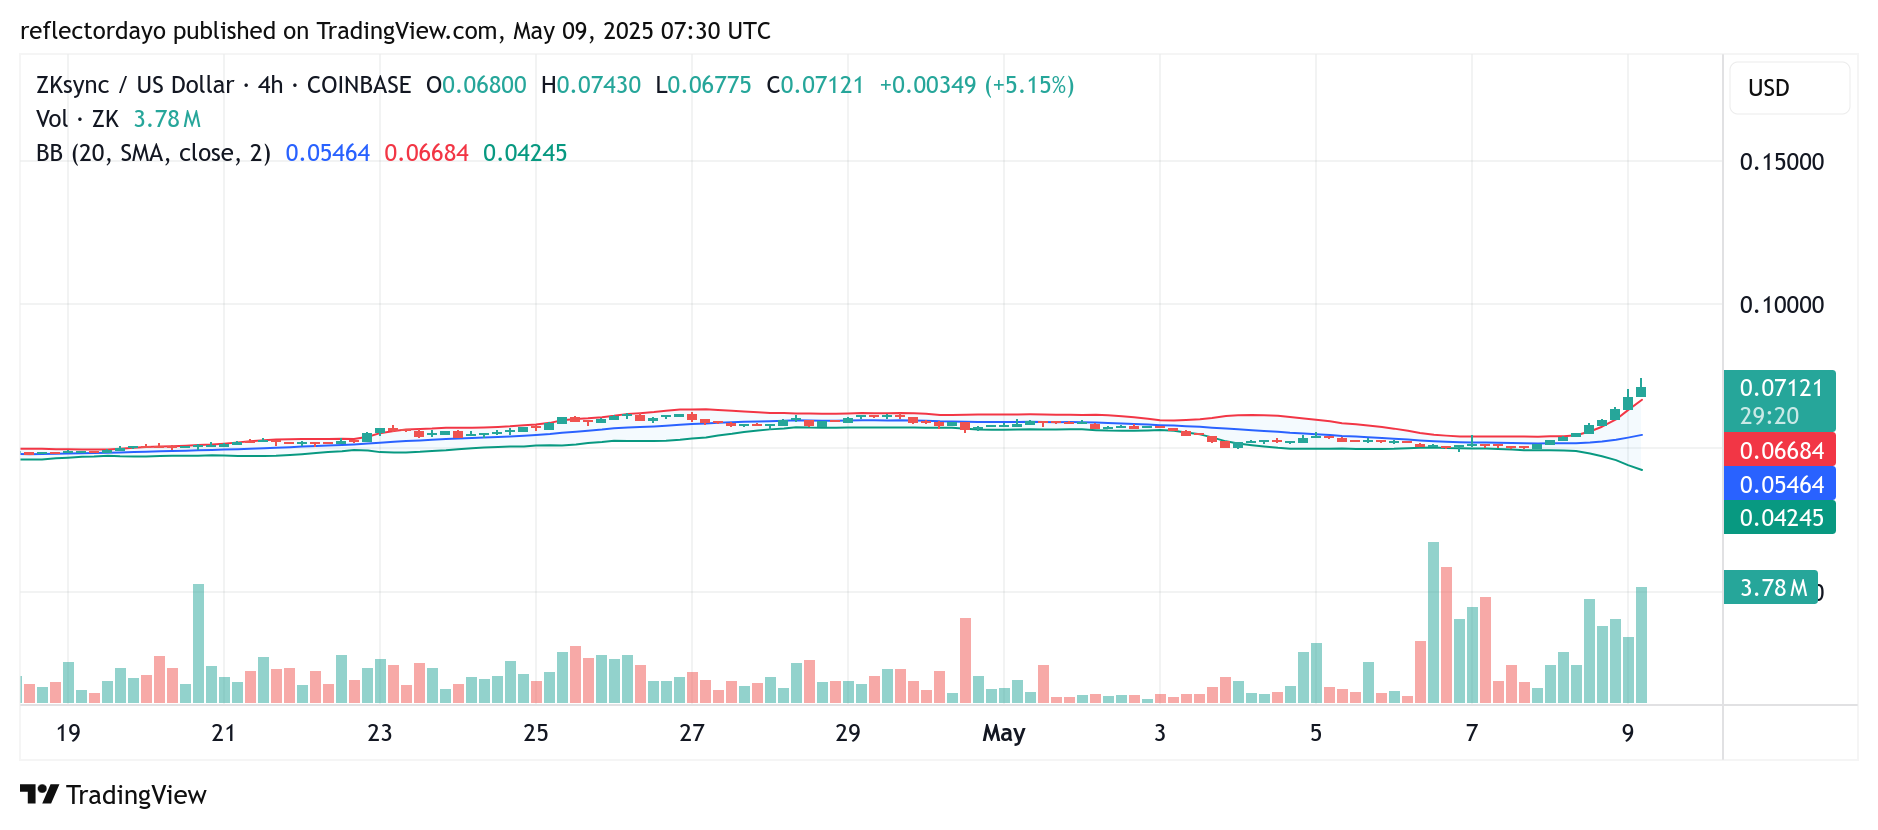
ZKsync (ZK/USD) 4-Hour Chart Analysis: Rising Caution as Price Tests Key Resistance
Zooming into the 4-hour chart provides deeper insight into the prevailing sentiment in the ZKsync (ZK/USD) market. As the price continues its upward movement, upper shadows have begun to appear consistently on candlesticks, indicating increased trader caution. These shadows suggest that sellers are placing orders near the $0.075 level, anticipating potential resistance.
Additionally, the Bollinger Bands show a widening pattern, signaling increased market volatility as the bullish run progresses. This growing volatility may offer bears an opportunity to respond with resistance, particularly around key price zones they previously controlled. If bearish pressure intensifies at these levels, a rejection or short-term correction could occur before the market resumes its upward trajectory.