Cardano Recovers but Encounters Resistance at $0.32
Estimated Reading Time: 2 minutes
Don’t invest unless you’re prepared to lose all the money you invest. This is a high-risk investment and you are unlikely to be protected if something goes wrong. Take 2 minutes to learn more
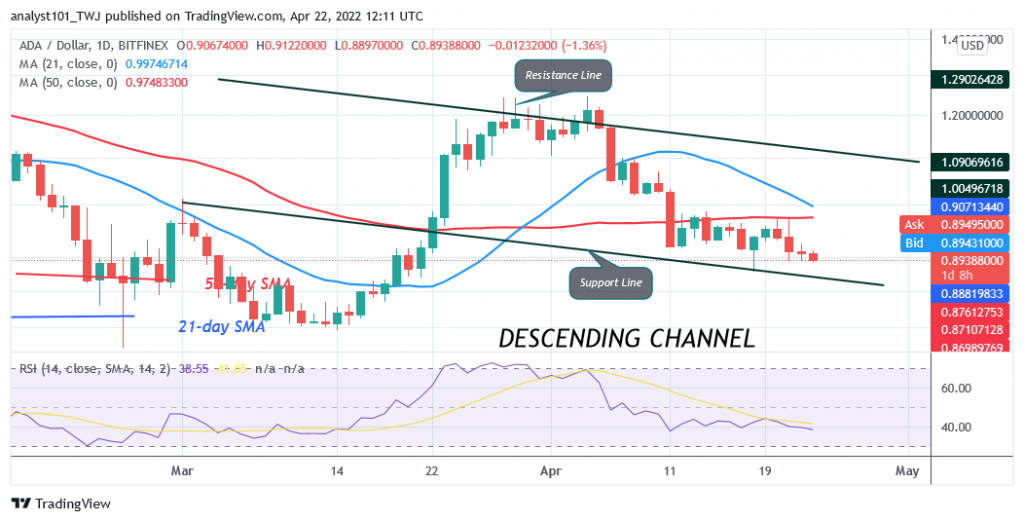
Cardano (ADA) Price Long-Term Forecast: Bearish
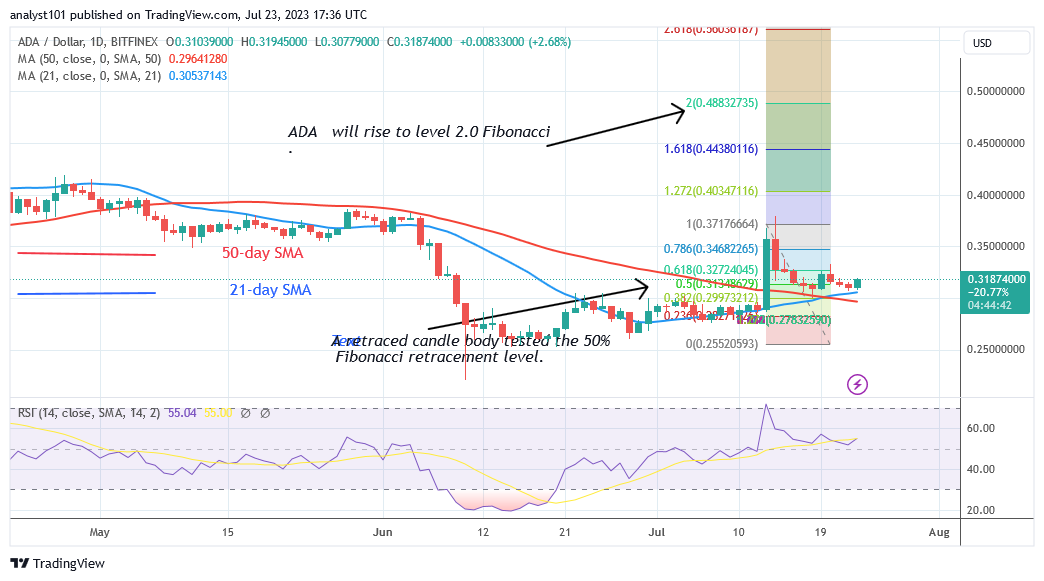
Following the price rally on July 13, Cardano (ADA) has retraced and found support above the moving average lines but encounters resistance at $0.32. While trading in the bullish trend zone, the crypto asset has the potential for further upward growth. The price indicator suggested that prices will rise further. A retraced candle body tested the 50% Fibonacci retracement level on July 13 upswing.
The retracement means that ADA will increase to the Fibonacci extension level of 2.0, or $0.488. Meanwhile, the current upswing will be tested near the $0.36 high.
Technical Indicators:
Major supply zones: $1.0, $1.05, $1.10
Major demand zones: $0.45, $0.40, $0.35
Cardano (ADA) Indicator Analysis
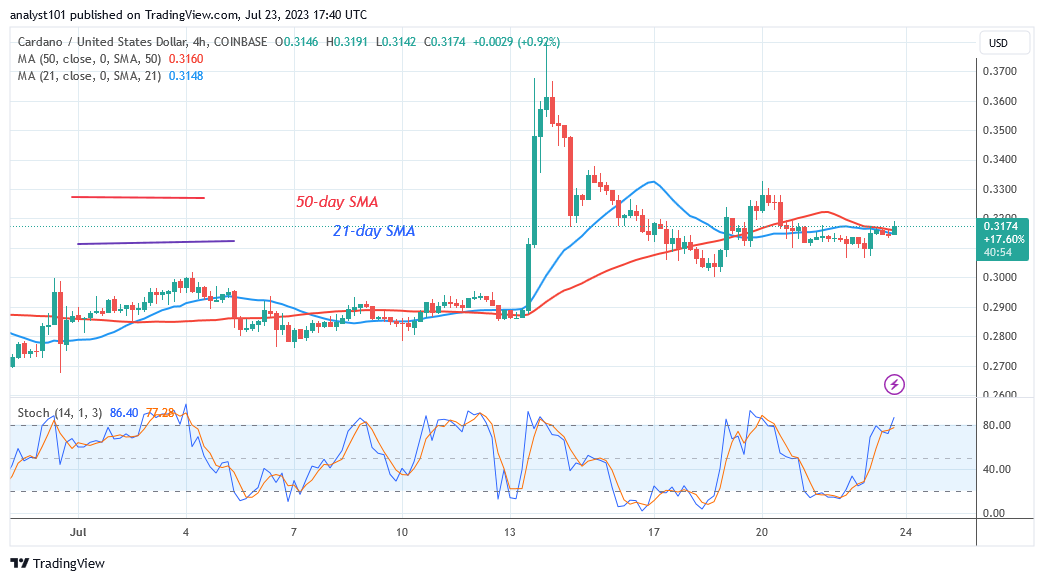
Cardano is in a bullish trend zone at the Relative Strength Index level of 54. ADA can surpass its previous high. As ADA resumes its upward movement, the price bars have moved above the moving average lines. Cardano is rising over the 75th level of the daily Stochastic. The surge is currently reaching overbought territory.
What Is the Next Move for Cardano (ADA)?
The formation of Doji candlesticks has limited Cardano’s upward movement as it encounters resistance at $0.32. The coin is also approaching the market’s overbought zone. The resistance at $0.32 is currently limiting the upward movement. Cardano will begin an uptrend if it recovers above the present support level.
You can purchase crypto coins here. Buy LBLOCK
Note: Cryptosignals.org is not a financial advisor. Do your research before investing your funds in any financial asset or presented product or event. We are not responsible for your investing results