Chainlink Enters a Sideways Trend as It Trades above $14.80
Estimated Reading Time: 2 minutes
Don’t invest unless you’re prepared to lose all the money you invest. This is a high-risk investment and you are unlikely to be protected if something goes wrong. Take 2 minutes to learn more

Chainlink (LINK) Long-Term Analysis: Ranging
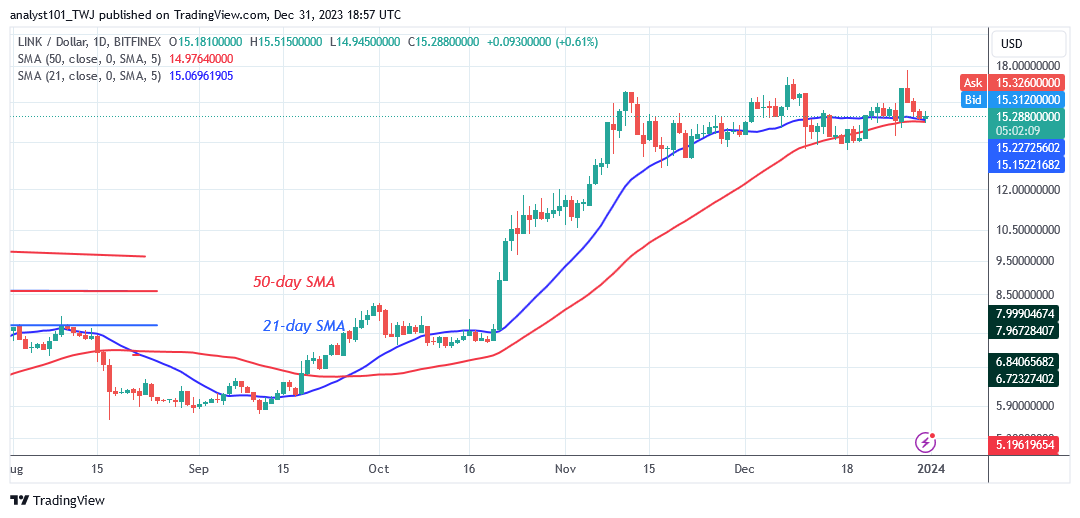
Chainlink (LINK) has not been able to break above the resistance level of $17.00 as it trades above $14.80. Following its rejection at $17.77 on December 28, LINK’s price has been declining since then. The altcoin is up today after finding support above the line of its 21-day moving average.
Since November 11, this has been the pricing action, with LINK/USD oscillating between $14.00 and $17.50. Today, LINK/USD is valued $15.82 at the time of writing. The coin is moving higher as it gets closer to the $17.00 barrier level. If the existing barrier is broken, Chainlink will rise to a high of $22. In the meantime, the existence of Doji candlesticks has restricted the amount of price movement.
Technical indicators:
Major Resistance Levels – $8.00, $10.00, $12.00
Major Support Levels – $6.00, $4.00, $2.00
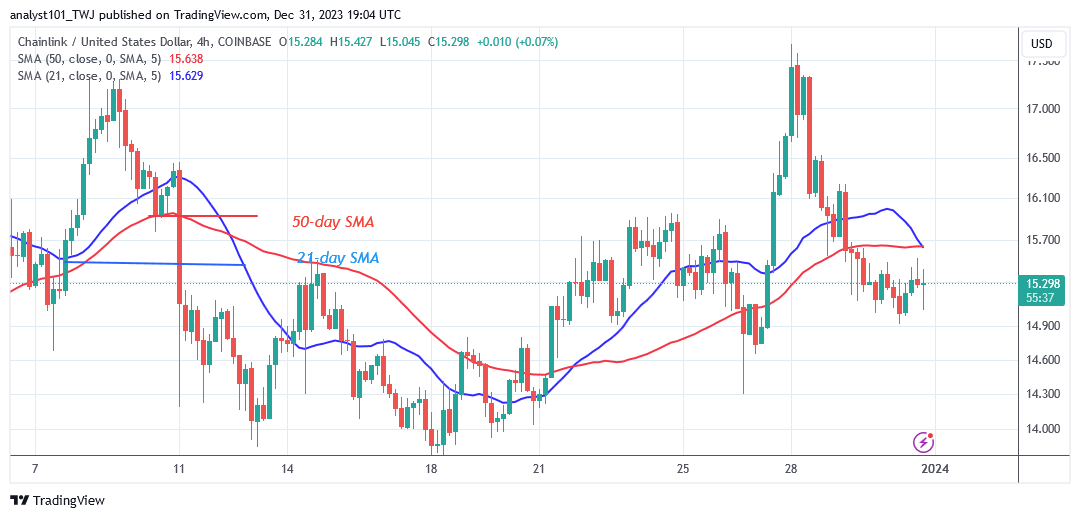
Chainlink (LINK) Indicator Analysis
The price bars are above the horizontal sloping moving average lines. The price bars are either below or above the moving average lines in some situations, causing the asset to enter a sideways trend. The altcoin is currently rising as the price remains above the moving average lines. Doji candlestick’s dominance caused the altcoin to move modestly.
What Is the Next Direction for Chainlink (LINK)?
Chainlink moves sideways above the moving average lines as it trades above $14.80. The Doji candlesticks have often limited price fluctuation. The barrier near $17 has prevented the upward movement, resulting in a sideways trend.
You can purchase crypto coins here. Buy LBLOCK
Note: Cryptosignals.org is not a financial advisor. Do your research before investing your funds in any financial asset or presented product or event. We are not responsible for your investing result