Chainlink Enters Overbought Zone as It Risks Rejection at $13.33
Estimated Reading Time: 2 minutes
Don’t invest unless you’re prepared to lose all the money you invest. This is a high-risk investment and you are unlikely to be protected if something goes wrong. Take 2 minutes to learn more

Chainlink (LINK) Long-Term Analysis: Bullish
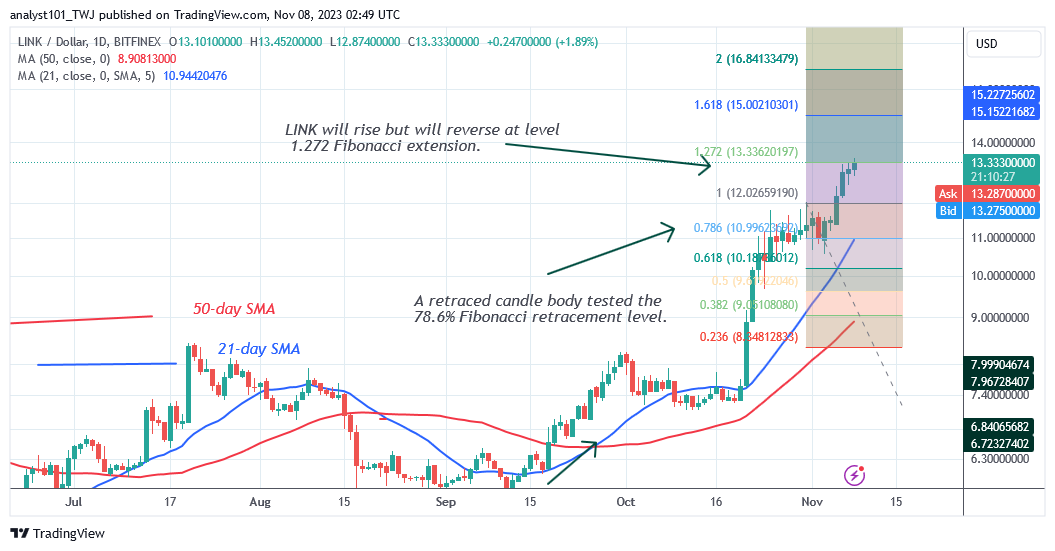
Chainlink (LINK) resumes its upward trajectory as it risks rejection at $13.33. Since October 21, the rise has been continuous. However, the price movement has been halted for nearly a week at the $12 resistance level. Nonetheless, the bulls burst through the barrier level on November 5 to restart the upward trend.
A retraced candle body tested the 78.6% Fibonacci retracement line on the October 31 upswing. The retracement suggests that LINK/USD would increase but then reverse at the 1.272 Fibonacci extension or level of $13.33 . The altcoin’s price has achieved a high of $13.20 at the time of writing.
Technical indicators:
Major Resistance Levels – $8.00, $10.00, $12.00
Major Support Levels – $6.00, $4.00, $2.00
Chainlink (LINK) Indicator Analysis
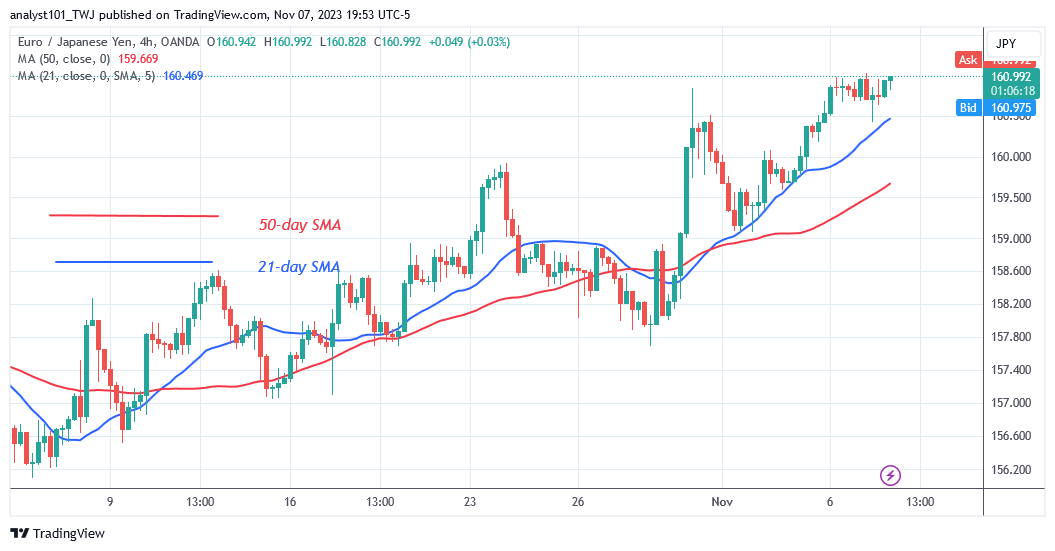
The moving average lines on the 4-hour chart are sloping parallel in different directions as the altcoin consolidates above the $10.50 support. On November 5, the moving average lines are sliding upward as the LINK price recovers. Given the current price rally, Chainlink has entered the overbought zone.
What Is the Next Direction for Chainlink (LINK)?
At today’s high of $13.25, the LINK/USD pair has reached bullish exhaustion as it risks rejection at $13.33. The price indicator predicted a likely reverse at the most recent top. The altcoin will drop and find support above the $10.50 mark if it retraces. The current upswing, however, will stop if the price falls below the moving average lines.
You can purchase crypto coins here. Buy LBLOCK
Note: Cryptosignals.org is not a financial advisor. Do your research before investing your funds in any financial asset or presented product or event. We are not responsible for your investing result