Chainlink (LINK) Is In a Downward Correction, May Face Rejection at the Overhead Resistance at $35
Estimated Reading Time: 2 minutes
Don’t invest unless you’re prepared to lose all the money you invest. This is a high-risk investment and you are unlikely to be protected if something goes wrong. Take 2 minutes to learn more
Chainlink (LINK) Long-Term Analysis: Bullish
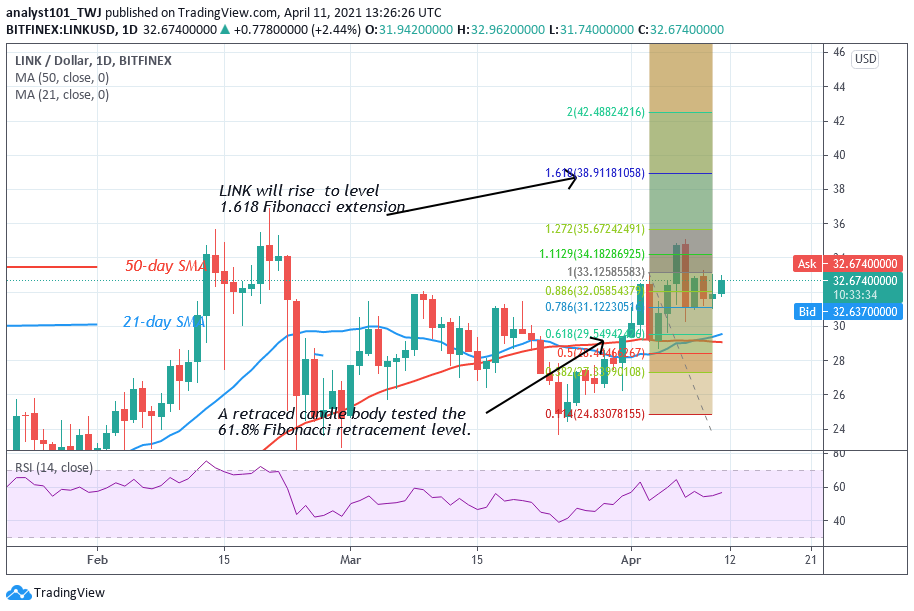
Chainlink has commenced an upward move to retest the $35 overhead resistance. Since February 13, buyers have failed to push LINK above the overhead resistance. Consequently, the crypto has been in a downward correction. If buyers can break the $35 overhead resistance, LINK will rally above $40. However, the downward correction will continue if buyers fail to break the overhead resistance. Meanwhile, on April 3 uptrend; a retraced candle body tested the 61.8% Fibonacci retracement level. This retracement implies that LINK will rise to level 1.618 Fibonacci extension or $38.91 high.
Chainlink (LINK) Indicator Analysis
LINK is at level 56 of the Relative Strength Index period 14. It indicates that the uptrend zone and above the centerline 50. Also, XRP is in the bullish trend zone. The 21-day SMA and the 50-day SMA are sloping up indicating the previous sideways move.
Technical indicators:
Major Resistance Levels – $40.00, $42.00, $44.00
Major Support Levels – $26.00, $24.00, $22.00
What Is the Next Direction for Chainlink (LINK)?
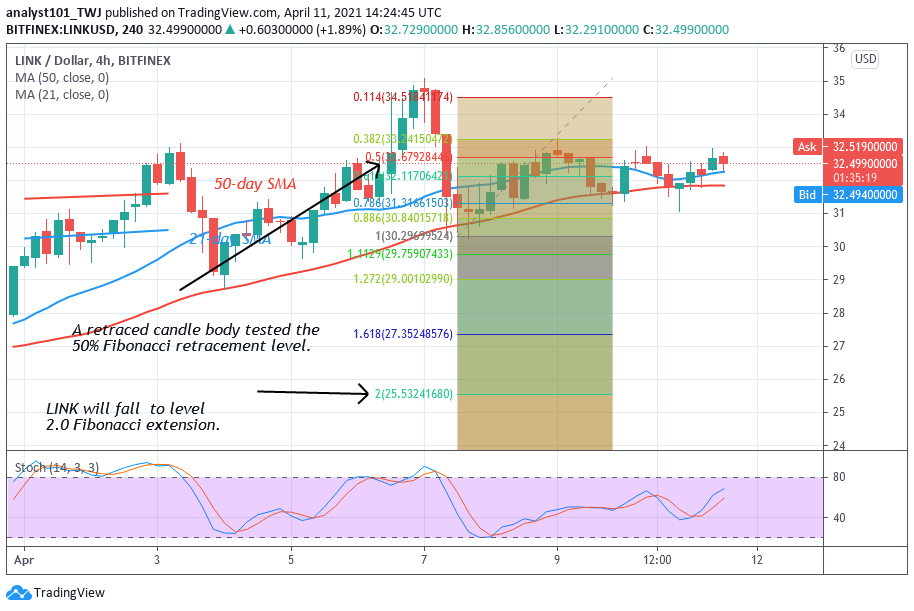
LINK is falling because the market is facing rejection at the resistance zone. Today, the Fibonacci tool has indicated a downward movement of the crypto. On April 7 downtrend, a retraced candle tested the 50% Fibonacci retracement level. It indicates LINK will fall to level 2.0 Fibonacci extension or $25.53 low. From the price action, LINK is facing rejection from the recent high.
Note: cryptosignals.org is not a financial advisor. Do your research before investing your funds in any financial asset or presented product or event. We are not responsible for your investing results