Chainlink (LINK) Makes a Series of Lower Highs and Lower Lows, Targets Level $24
Estimated Reading Time: 2 minutes
Don’t invest unless you’re prepared to lose all the money you invest. This is a high-risk investment and you are unlikely to be protected if something goes wrong. Take 2 minutes to learn more
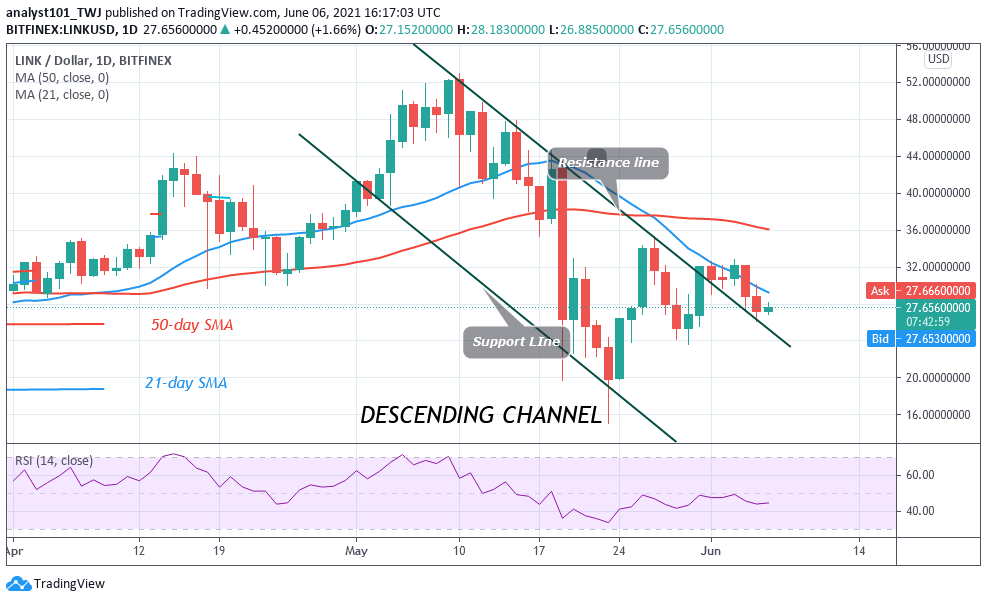
Chainlink (LINK) Long-Term Analysis: Bearish
Chainlink (LINK) is in a downward move. Before the resumption of selling pressure, buyers were struggling to break the resistance at $32. After three unsuccessful attempts, the downtrend resumes as price falls. The market is likely to decline and reach the previous low at $24. Chainlink price is below the moving averages which suggests further downsides.
Chainlink (LINK) Indicator Analysis
The crypto is at level 44 of the Relative Strength Index period 14. It indicates that it is in the downtrend zone and below the centerline 50. The crypto is in the bearish trend zone and is capable of falling on the downside. The 21-day SMA and 50-day SMA are sloping southward indicating the downtrend. The crypto is below 40% range of the daily stochastic. It indicates that the coin is in a bearish momentum.

Technical indicators:
Major Resistance Levels – $60, $62, $ 64
Major Support Levels – $30, $28, $26
.
What Is the Next Direction for Chainlink (LINK)?
Chainlink has resumed a downward move. On the 4 –hour chart, Chainlink price is making a series of lower highs and lower lows. Meanwhile, on June 4 downtrend; a retraced candle body tested the 61.8% Fibonacci retracement level. This retracement indicates that the market will fall to level 1.618 Fibonacci extensions or the low of $23.94.

Note: new.cryptosignals.org is not a financial advisor. Do your research before investing your funds in any financial asset or presented product or event. We are not responsible for your investing results