Chainlink Oscillates as It Maintains Its Hold above $5.80
Estimated Reading Time: 2 minutes
Don’t invest unless you’re prepared to lose all the money you invest. This is a high-risk investment and you are unlikely to be protected if something goes wrong. Take 2 minutes to learn more
Chainlink (LINK) Long-Term Analysis: Ranging
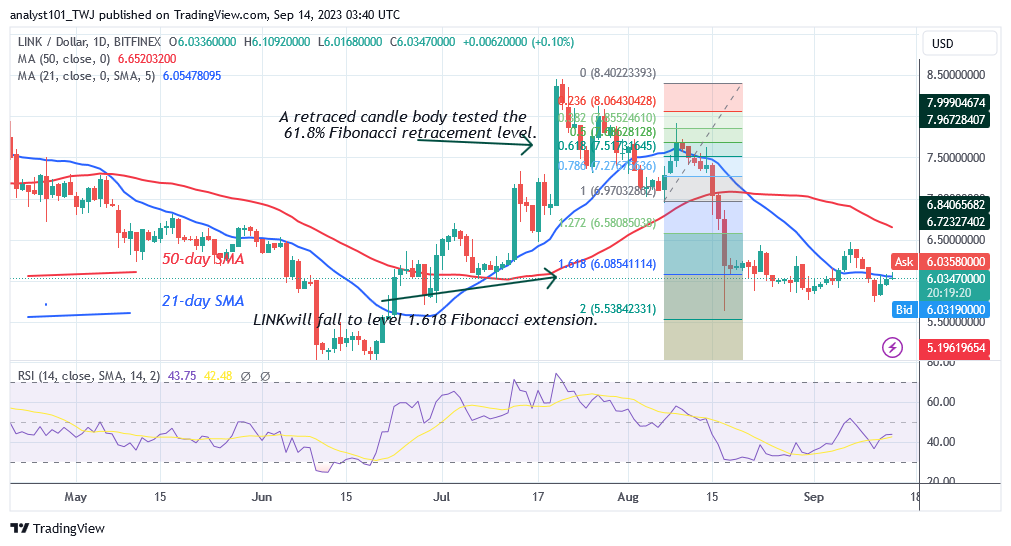
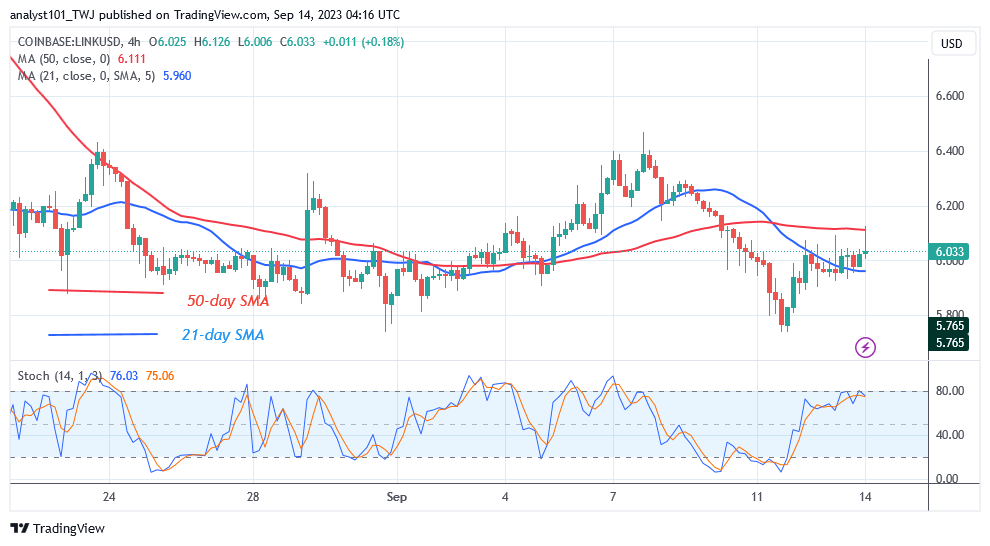
Chainlink (LINK) has continued to fluctuate within a fixed range as it maintains its hold above $5.80. The price of the cryptocurrency asset has been oscillating between $5.80 and $6.40. On September 11, bears drove the cryptocurrency to a low of $5.74, while bulls purchased the dips. At the time of writing, the altcoin has reached a high of $6.03.
Meanwhile, the price indicator previously forecasted a drop in the cryptocurrency to the 1.618 Fibonacci extension, or $6.08. According to the price action, the altcoin fell to lows of $5.63 and $5.74 before reclaiming the $6.00 support level. Meanwhile, the LINK/USD remains range-bound, holding above the $6.00 support.
Technical indicators:
Major Resistance Levels – $8.00, $10.00, $12.00
Major Support Levels – $6.00, $4.00, $2.00
Chainlink (LINK) Indicator Analysis
Chainlink is correcting upward as it reaches the Relative Strength Index level 43 for period 14. The altcoin is at risk of dropping because it is in a bearish trend. The price bars have been oscillating between and below the moving average lines, indicating a sideways trend. The coin is currently trading above level 60 of the daily Stochastic.
The bullish momentum has slowed as it approaches overbought territory.
What Is the Next Direction for Chainlink (LINK)?
Chainlink stays above the bottom price range as it maintains its hold above $5.80. The altcoin has been caught between the moving average lines in the lower price range. This is a hint of the cryptocurrency’s potential range-bound movement. Meanwhile, the altcoin is suffering rejection as it approaches the overbought zone.
You can purchase crypto coins here. Buy LBLOCK
Note: Cryptosignals.org is not a financial advisor. Do your research before investing your funds in any financial asset or presented product or event. We are not responsible for your investing results