Chainlink Recovers from Decline but Sways beneath the $7.00 Barrier
Estimated Reading Time: 2 minutes
Don’t invest unless you’re prepared to lose all the money you invest. This is a high-risk investment and you are unlikely to be protected if something goes wrong. Take 2 minutes to learn more
Chainlink (LINK) Long-Term Analysis: Bearish
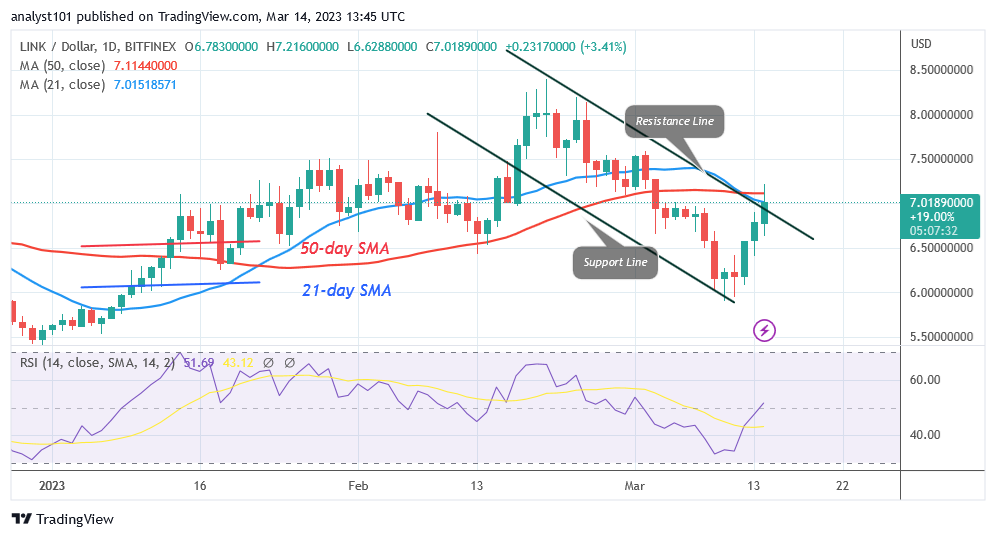
Chainlink’s (LINK) price is correcting upward as it sways beneath the $7.00 barriers. At this time, the bullish momentum has stopped at the moving average lines. On March 14, Chainlink reached a high of $7.21 but was unable to continue the positive trend. The $6.75 breakthrough level is where the cryptocurrency value is currently receding. The altcoin will resume a new rise if support is found above the breakout level or the $6.60 support. The price will restart its upward trend in Chainlink if it rises above the moving average lines. The market will increase and reach its prior high of $8.28. Selling pressure will increase if the price falls below the $6.75 breakthrough level, though. The cryptocurrency will reach the $6.00 support.
Chainlink (LINK) Indicator Analysis
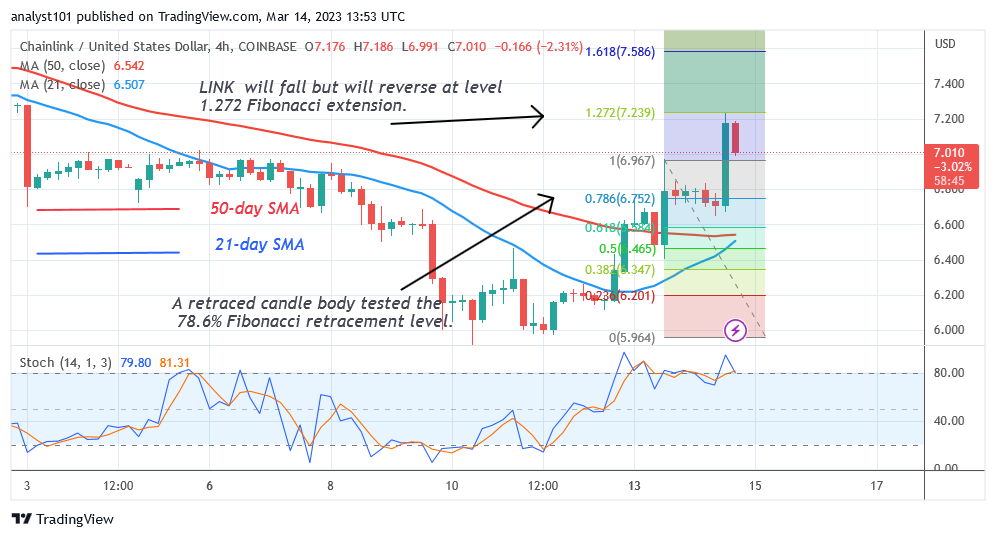
The altcoin is correcting upward as it approaches the Relative Strength Index level 49 for period 14. The equilibrium between supply and demand has caused the price of the crypto to stabilize at this level. The price bars are below the moving average lines, which causes the alternative currency to decline. Chainlink is trading in the daily Stochastic overbought region at level 80.
Technical indicators:
Major Resistance Levels – $18.00, $20.00, $22.00
Major Support Levels – $8.00, $6.00, $4.00
What Is the Next Direction for Chainlink (LINK)?
Chainlink is attempting to overcome the resistance as it sways beneath the $7.00 barriers. The bullish momentum has slowed by the time the market reaches the overbought region. The altcoin is swaying beneath the $7.00 barrier. The altcoin will increase until buyers maintain the price over the $7.00 resistance mark.
You can purchase crypto coins here. Buy LBLOCK
Note: Cryptosignals.org is not a financial advisor. Do your research before investing your funds in any financial asset or presented product or event. We are not responsible for your investing results