Compound (COMPUSD) Falls As Price Diverges Against The RSI Indicator
Estimated Reading Time: 2 minutes
Don’t invest unless you’re prepared to lose all the money you invest. This is a high-risk investment and you are unlikely to be protected if something goes wrong. Take 2 minutes to learn more
COMPUSD Analysis – Market Falls As Price Diverges Against The RSI Indicator
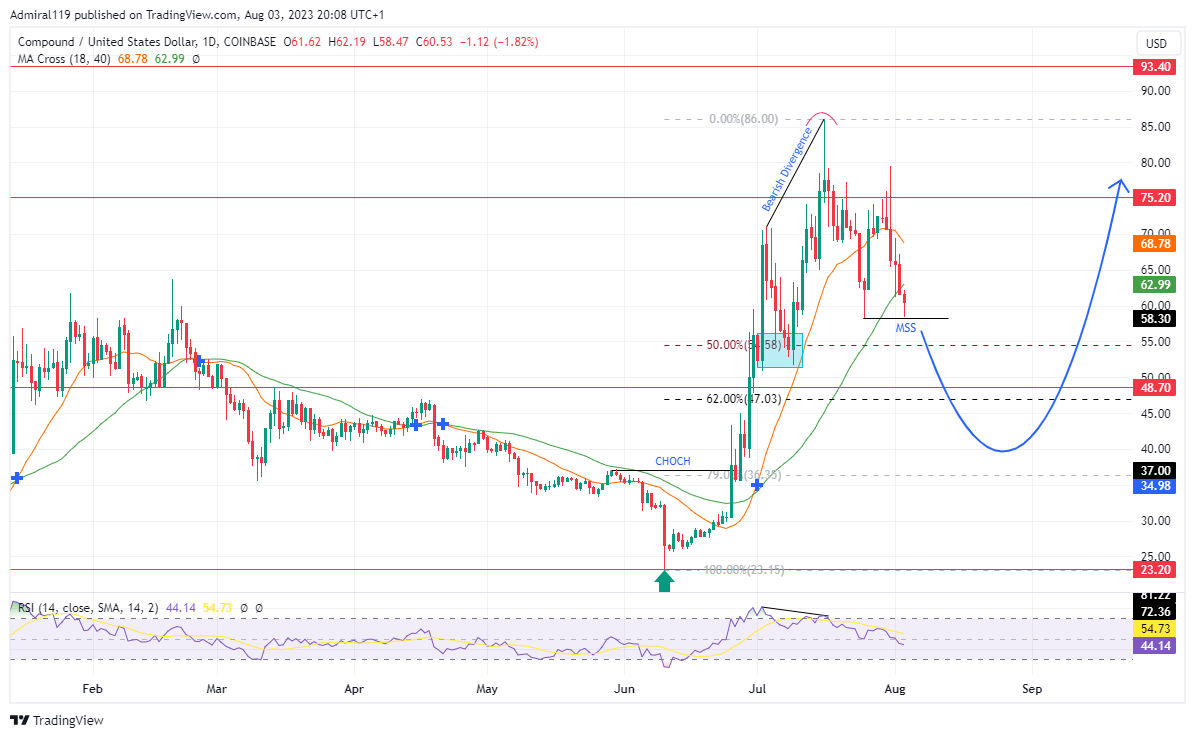
COMPUSD falls as price diverges against the RSI (Relative Strength Index) indicator. Since the Change of Character in June 2023, the market has been in a bullish trend. However, due to the divergence between the RSI and the price at the premium, COMPUSD is about to flip bearish.
COMPUSD Significant Zones
Demand Zones: $48.70, $23.20
Supply Zones: $75.20, $93.40

Before the CHOCH in June 2023, COMPUSD was bearish according to the MA Cross. The market fell from the previous resistance at $48.70 to the downside. On getting to the $23.20 support, the price made a reversal and swerved upward. Coupled with the buying pressure at the $23.20 support, the reversal expands into a massive rally. This led to a change of character as COMPUSD flipped bullishly and continued the massive rally.
As the rally continued, a bullish order block formed around the $55.00 psychological level. The order block further propelled the price into the premium zone. After the sequential formation of the highs at the $70.90 and $86.00 price levels at the premium, the price dived. At the $58.30 price level, a lower low formed. From the $58.30 low, the price expanded upward to form a lower high at $79.50. COMPUSD has since been falling as it moves to form another low below the previous low at $58.30.

Market Expectation
Following the bearish divergence indication, the market’s direction has been bearish. On the four-hour chart, a weak high has formed at the $69.50 price level. Invalidation of the $69.50 weak high is expected to lead to a massive decline to the downside.
You can purchase Lucky Block here. Buy LBLOCK
Note: Cryptosignals.org is not a financial advisor. Do your research before investing your funds in any financial asset or presented product or event. We are not responsible for your investing results.