Compound (COMPUSD) Keeps Consolidating Within the Bollinger Bands Indicator
Estimated Reading Time: 3 minutes
Don’t invest unless you’re prepared to lose all the money you invest. This is a high-risk investment and you are unlikely to be protected if something goes wrong. Take 2 minutes to learn more
COMPUSD Analysis – Price keeps consolidating within the Bollinger Bands Indicator
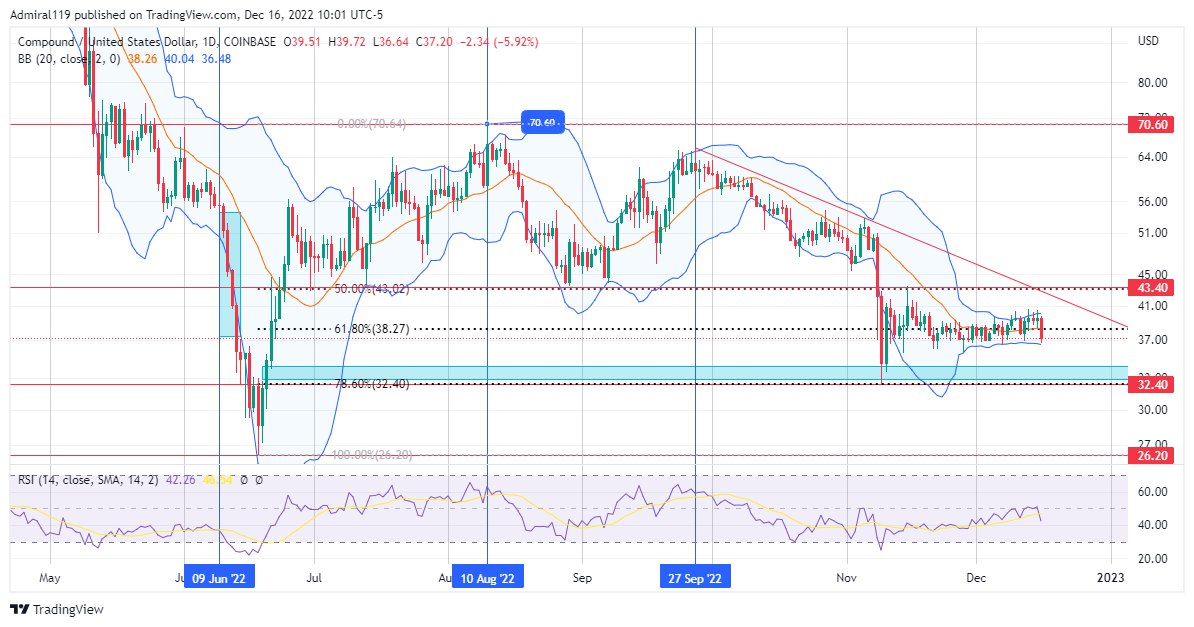
COMPUSD keeps consolidating within the Bollinger Bands Indicator. The market has been in a downtrend since September 27, 2022. However, there seems to be an equal and opposite force resisting the downward flow. According to the Relative Strength Index indicator, the market has remained below the 50.0 level longer than the time it spent above it.
COMPUSD Significant Zones
Demand Zone: 32.40, 22.60
Supply Zones: 43.40, 70.60
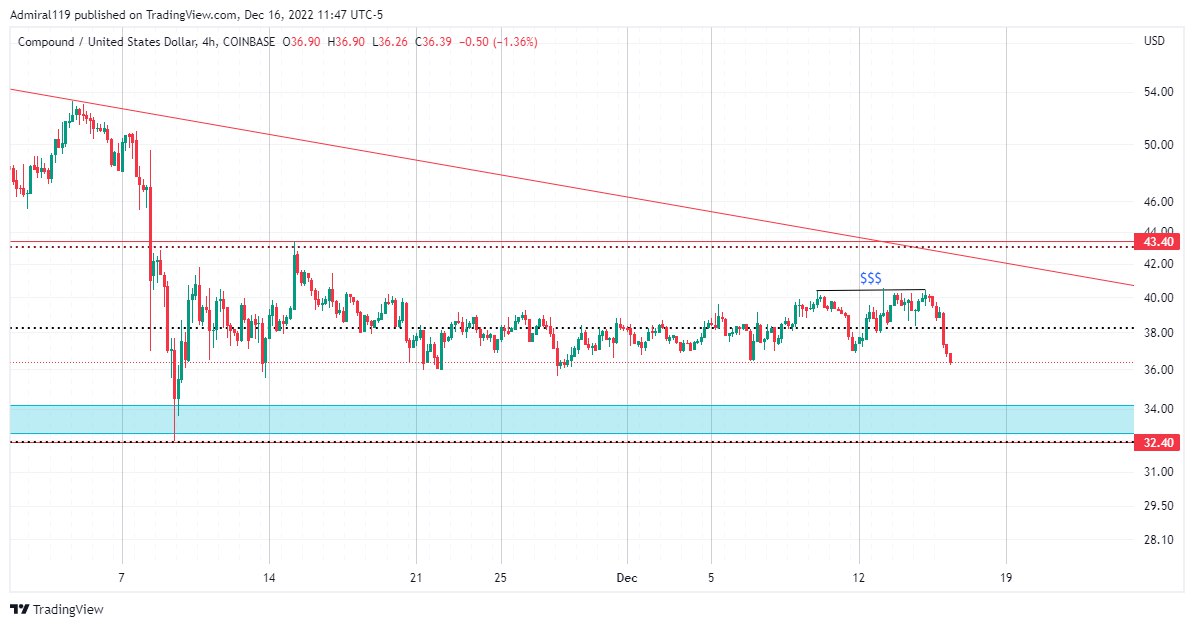
Since the 70.60 price level, the market has been converging within the Bollinger Bands and in a triangle-like pattern. The triangle-like pattern is made up of the diagonal resistance and the daily bullish order block just above the 32.40 demand level. Since the market’s order flow is bullish, the COMPUSD sellers must be waiting for the price to hit the diagonal resistance for the third time before placing more sell orders. As of now, the buying pressure from the daily bullish order block is averting the intentions of the bears, even in this downtrend environment. When the previous support at the 70.60 prices was broken, COMPUSD crashed massively to the downside.
As the market crashed, the COMPUSD sellers’ traces were left in the form of a liquidity void. The liquidity void was later filled to balance the market’s inefficiency. From the 26.20 demand level, prices rose rapidly with a strong affinity to get the liquidity void filled. The rapid expansion to the upside resulted in the creation of a swing high at the 70.60 price level. The market’s current range is defined by these two significant levels of 70.60 and 26.20.
Market Expectation
Since the daily bullish order block was reached, the market has been finding it difficult to continue crashing downward. However, once the consolidation on the four-hour chart is complete, the COMPUSD is expected to resume its downtrend as the daily order block is removed.
You can purchase Lucky Block here. Buy LBLOCK
Note: Cryptosignals.org is not a financial advisor. Do your research before investing your funds in any financial asset or presented product or event. We are not responsible for your investing results.